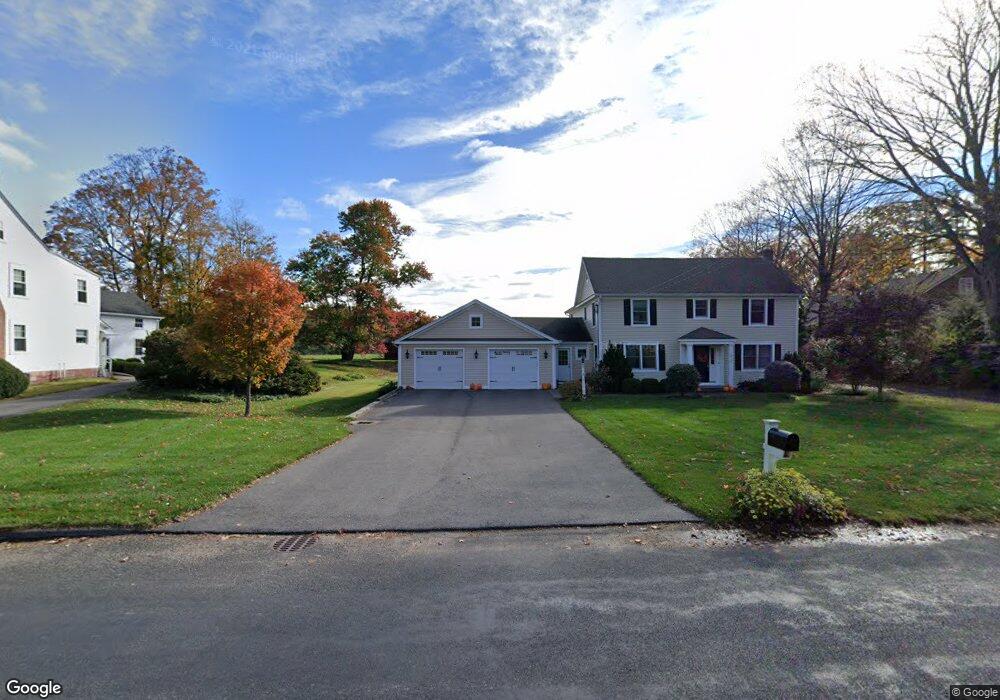
1016 Main St South Windsor, CT 06074
Estimated Value: $476,000 - $582,341
3
Beds
3
Baths
2,820
Sq Ft
$186/Sq Ft
Est. Value
About This Home
This home is located at 1016 Main St, South Windsor, CT 06074 and is currently estimated at $525,585, approximately $186 per square foot. 1016 Main St is a home located in Hartford County with nearby schools including Timothy Edwards School and South Windsor High School.
Ownership History
Date
Name
Owned For
Owner Type
Purchase Details
Closed on
Dec 1, 2023
Sold by
Waldron Shirley
Bought by
Smith Kyle S and Brennan Erin M
Current Estimated Value
Purchase Details
Closed on
Nov 30, 2012
Sold by
Smith Shirley W and Waldron Vesta S
Bought by
Smith Kyle A and Brennan Erin M
Purchase Details
Closed on
Nov 27, 1990
Sold by
Benson Josephine
Bought by
Waldron S S and Waldron V
Home Financials for this Owner
Home Financials are based on the most recent Mortgage that was taken out on this home.
Original Mortgage
$100,000
Interest Rate
10.19%
Mortgage Type
Purchase Money Mortgage
Create a Home Valuation Report for This Property
The Home Valuation Report is an in-depth analysis detailing your home's value as well as a comparison with similar homes in the area
Home Values in the Area
Average Home Value in this Area
Purchase History
| Date | Buyer | Sale Price | Title Company |
|---|---|---|---|
| Smith Kyle S | -- | None Available | |
| Smith Kyle S | -- | None Available | |
| Smith Kyle A | -- | -- | |
| Waldron S S | $192,000 | -- |
Source: Public Records
Mortgage History
| Date | Status | Borrower | Loan Amount |
|---|---|---|---|
| Previous Owner | Waldron S S | $100,000 | |
| Previous Owner | Waldron S S | $6,000 |
Source: Public Records
Tax History Compared to Growth
Tax History
| Year | Tax Paid | Tax Assessment Tax Assessment Total Assessment is a certain percentage of the fair market value that is determined by local assessors to be the total taxable value of land and additions on the property. | Land | Improvement |
|---|---|---|---|---|
| 2024 | $11,579 | $336,000 | $96,300 | $239,700 |
| 2023 | $11,135 | $336,000 | $96,300 | $239,700 |
| 2022 | $9,898 | $255,300 | $89,800 | $165,500 |
| 2021 | $9,666 | $255,300 | $89,800 | $165,500 |
| 2020 | $9,671 | $255,300 | $89,800 | $165,500 |
| 2019 | $9,829 | $255,300 | $89,800 | $165,500 |
| 2018 | $9,617 | $255,300 | $89,800 | $165,500 |
| 2017 | $9,193 | $241,400 | $89,800 | $151,600 |
| 2016 | $9,014 | $241,400 | $89,800 | $151,600 |
| 2015 | $8,821 | $241,400 | $89,800 | $151,600 |
| 2014 | $8,572 | $241,400 | $89,800 | $151,600 |
Source: Public Records
Map
Nearby Homes
- 1063 Main St
- 951 Main St
- 51 Pleasant Valley Rd
- 749 Main St
- 220 Pepin Place Unit 220
- 438 Pleasant Valley Rd
- 75 Sharon Dr
- 404 Strong Rd
- 119 Joshua Hill
- 110 Strong Rd
- 1638 Main St
- 561 Strong Rd
- 11 Saint Marc Cir O Cir
- 1 Saint Marc Cir Unit A
- 5 Saint Marc Cir Unit H
- 50 Parkview Dr
- 101 Seymour St
- 140 Portman St
- 157 Henry St
- 58 Amanda Cir