Estimated Value: $281,000 - $298,000
3
Beds
1
Bath
986
Sq Ft
$294/Sq Ft
Est. Value
About This Home
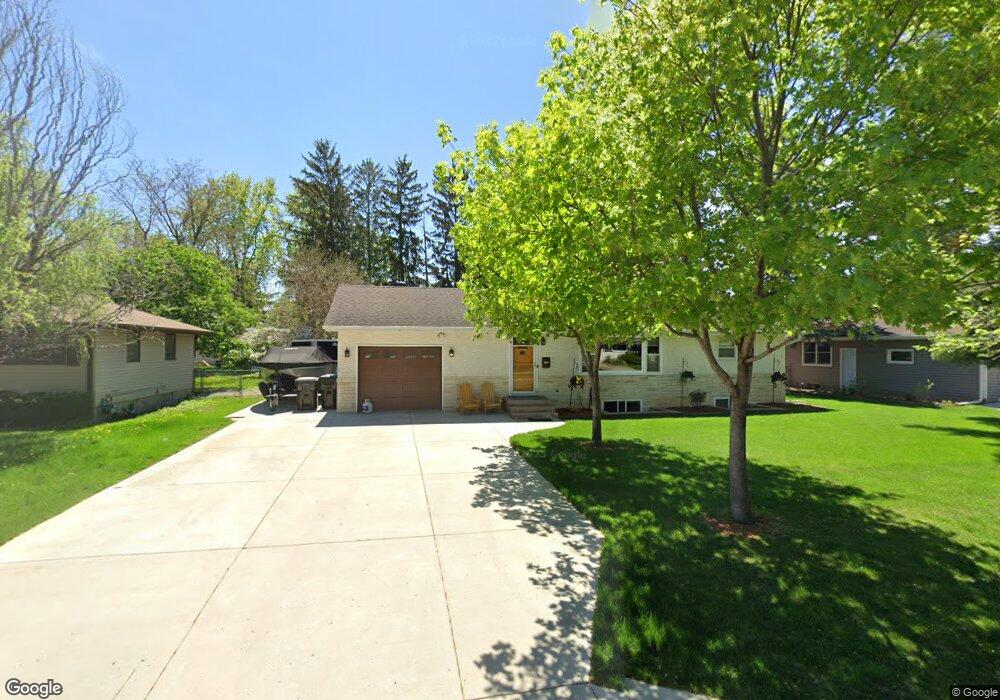
This home is located at 1016 Monroe St, Anoka, MN 55303 and is currently estimated at $290,322, approximately $294 per square foot. 1016 Monroe St is a home located in Anoka County with nearby schools including Lincoln Elementary School for the Arts, Anoka Middle School for the Arts - Fred Moor Campus, and Anoka Senior High School.
Ownership History
Date
Name
Owned For
Owner Type
Purchase Details
Closed on
Mar 27, 2014
Sold by
Horbal Gerald W and Horbal Laura L
Bought by
Horbal Gerald W and Horbal Laura L
Current Estimated Value
Purchase Details
Closed on
Mar 21, 2013
Sold by
Horbal Vivian
Bought by
Horbal Gerald W
Purchase Details
Closed on
Aug 31, 1998
Sold by
Panning Gregg S
Bought by
Horbal Vivian
Purchase Details
Closed on
Dec 29, 1997
Sold by
Panning Virgil F and Panning Carole C
Bought by
Panning Gregg S
Create a Home Valuation Report for This Property
The Home Valuation Report is an in-depth analysis detailing your home's value as well as a comparison with similar homes in the area
Home Values in the Area
Average Home Value in this Area
Purchase History
| Date | Buyer | Sale Price | Title Company |
|---|---|---|---|
| Horbal Gerald W | -- | None Available | |
| Horbal Gerald W | -- | None Available | |
| Horbal Vivian | $106,100 | -- | |
| Panning Gregg S | $95,000 | -- | |
| Panning Gregg S | $95,000 | -- |
Source: Public Records
Mortgage History
| Date | Status | Borrower | Loan Amount |
|---|---|---|---|
| Closed | Panning Gregg S | -- |
Source: Public Records
Tax History Compared to Growth
Tax History
| Year | Tax Paid | Tax Assessment Tax Assessment Total Assessment is a certain percentage of the fair market value that is determined by local assessors to be the total taxable value of land and additions on the property. | Land | Improvement |
|---|---|---|---|---|
| 2025 | $3,351 | $255,900 | $72,000 | $183,900 |
| 2024 | $3,351 | $253,700 | $72,000 | $181,700 |
| 2023 | $4,613 | $255,600 | $72,000 | $183,600 |
| 2022 | $3,003 | $254,500 | $60,200 | $194,300 |
| 2021 | $2,879 | $212,500 | $57,000 | $155,500 |
| 2020 | $2,798 | $199,700 | $53,000 | $146,700 |
| 2019 | $2,731 | $190,400 | $52,000 | $138,400 |
| 2018 | $2,542 | $180,400 | $0 | $0 |
| 2017 | $2,411 | $160,300 | $0 | $0 |
| 2016 | $2,341 | $140,000 | $0 | $0 |
| 2015 | $1,553 | $140,000 | $46,500 | $93,500 |
| 2014 | -- | $111,300 | $30,000 | $81,300 |
Source: Public Records
Map
Nearby Homes