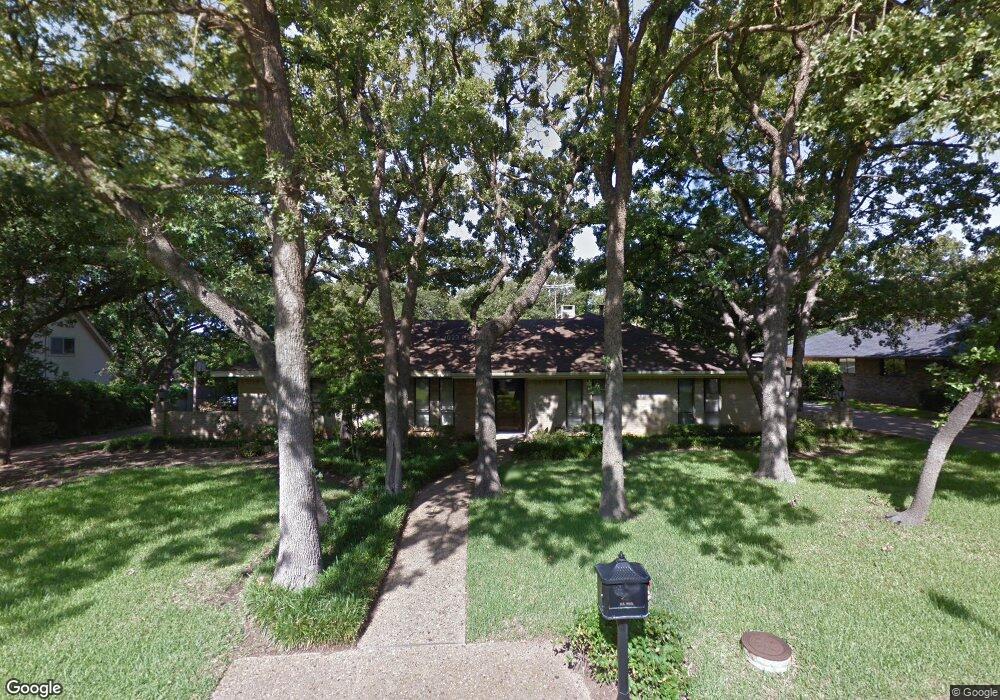
1016 Ridgecrest Cir Denton, TX 76205
South Denton NeighborhoodEstimated Value: $489,359 - $531,000
4
Beds
4
Baths
2,713
Sq Ft
$186/Sq Ft
Est. Value
About This Home
This home is located at 1016 Ridgecrest Cir, Denton, TX 76205 and is currently estimated at $504,590, approximately $185 per square foot. 1016 Ridgecrest Cir is a home located in Denton County with nearby schools including Houston Elementary School, McMath Middle School, and Denton High School.
Ownership History
Date
Name
Owned For
Owner Type
Purchase Details
Closed on
Oct 12, 2015
Sold by
Cowan Richard W and Cowan Pamela J
Bought by
Kilgore Sean and Kilgore Tiffani
Current Estimated Value
Home Financials for this Owner
Home Financials are based on the most recent Mortgage that was taken out on this home.
Original Mortgage
$250,355
Outstanding Balance
$199,415
Interest Rate
4.25%
Mortgage Type
FHA
Estimated Equity
$305,175
Purchase Details
Closed on
Apr 9, 2013
Sold by
Holloway Nancy Z
Bought by
Cowan Richard W and Cowan Pamela J
Home Financials for this Owner
Home Financials are based on the most recent Mortgage that was taken out on this home.
Original Mortgage
$207,633
Interest Rate
3.56%
Mortgage Type
VA
Purchase Details
Closed on
Dec 24, 2012
Sold by
Holloway Patrick H and Holloway David E
Bought by
Holloway Nancy Ferguson
Create a Home Valuation Report for This Property
The Home Valuation Report is an in-depth analysis detailing your home's value as well as a comparison with similar homes in the area
Home Values in the Area
Average Home Value in this Area
Purchase History
| Date | Buyer | Sale Price | Title Company |
|---|---|---|---|
| Kilgore Sean | -- | Title Resources | |
| Cowan Richard W | -- | Title Resources | |
| Holloway Nancy Ferguson | -- | None Available |
Source: Public Records
Mortgage History
| Date | Status | Borrower | Loan Amount |
|---|---|---|---|
| Open | Kilgore Sean | $250,355 | |
| Previous Owner | Cowan Richard W | $207,633 |
Source: Public Records
Tax History Compared to Growth
Tax History
| Year | Tax Paid | Tax Assessment Tax Assessment Total Assessment is a certain percentage of the fair market value that is determined by local assessors to be the total taxable value of land and additions on the property. | Land | Improvement |
|---|---|---|---|---|
| 2025 | $6,564 | $402,000 | $112,098 | $289,902 |
| 2024 | $7,759 | $402,000 | $112,098 | $289,902 |
| 2023 | $6,335 | $394,460 | $106,333 | $308,667 |
| 2022 | $7,612 | $358,600 | $98,910 | $307,090 |
| 2021 | $7,247 | $326,000 | $65,940 | $260,060 |
| 2020 | $6,994 | $306,000 | $65,940 | $240,060 |
| 2019 | $7,478 | $313,390 | $65,940 | $249,060 |
| 2018 | $6,882 | $284,900 | $65,940 | $233,060 |
| 2017 | $6,402 | $259,000 | $65,940 | $193,060 |
| 2016 | $6,402 | $259,000 | $65,940 | $193,060 |
| 2015 | $4,888 | $216,576 | $65,940 | $150,636 |
| 2014 | $4,888 | $195,360 | $72,317 | $123,043 |
| 2013 | -- | $198,926 | $72,317 | $126,609 |
Source: Public Records
Map
Nearby Homes
- 924 Ridgecrest Cir
- 2012 Hollyhill Ln
- 2218 Southridge Dr
- 209 Pennsylvania Dr
- 2253 Hollyhill Ln
- 1000 Lynhurst Ln
- 2226 Savannah Trail
- 1412 Ridgecrest Cir
- 2272 Hollyhill Ln
- 2216 Jefferson Trail
- 2120 Fairfax Rd
- 2100 Fairfax Rd
- 916 Smokerise Cir
- 829 Skylark Dr
- 412 Hollyhill Ln Unit 412
- 408 Hollyhill Ln
- 1012 Indian Ridge Dr
- 821 Sandpiper Dr
- 824 Sandpiper Dr
- 720 Smokerise Cir
- 1010 Ridgecrest Cir
- 1020 Ridgecrest Cir
- 2101 Stonegate Dr
- 2019 Stonegate Dr
- 1015 Ridgecrest Cir
- 1019 Ridgecrest Cir
- 2107 Stonegate Dr
- 1006 Ridgecrest Cir
- 1028 Ridgecrest Cir
- 2007 Stonegate Dr
- 1009 Ridgecrest Cir
- 1027 Ridgecrest Cir
- 2115 Stonegate Dr
- 1100 Ridgecrest Cir
- 2100 Stonegate Dr
- 2012 Stonegate Dr
- 400 Pennsylvania Dr
- 305 Ridgecrest Cir
- 309 Ridgecrest Cir
- 1005 Ridgecrest Cir