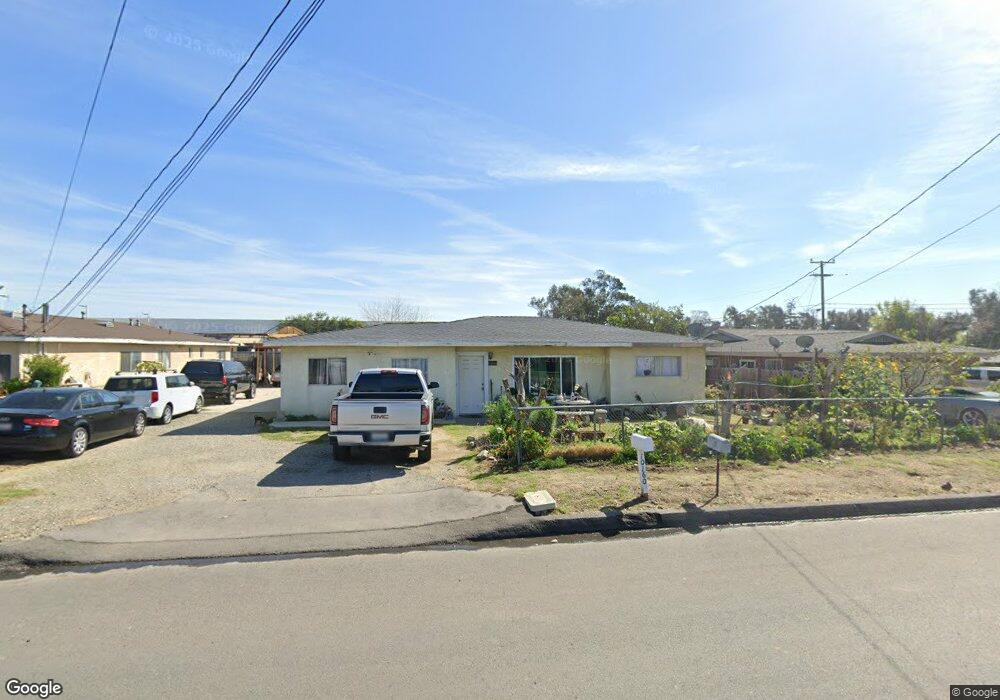
10161 Alder Ave Bloomington, CA 92316
Estimated Value: $348,000 - $784,000
3
Beds
1
Bath
1,044
Sq Ft
$503/Sq Ft
Est. Value
About This Home
This home is located at 10161 Alder Ave, Bloomington, CA 92316 and is currently estimated at $524,967, approximately $502 per square foot. 10161 Alder Ave is a home located in San Bernardino County with nearby schools including Mary B. Lewis Elementary School, Joe Baca, and Bloomington High School.
Ownership History
Date
Name
Owned For
Owner Type
Purchase Details
Closed on
May 4, 2022
Sold by
Ruiz Ramiro R
Bought by
Ruiz Ramiro R and Lopez Diana
Current Estimated Value
Purchase Details
Closed on
Dec 31, 2003
Sold by
Roberts Rand Eugene
Bought by
Ruiz Ramiro R
Home Financials for this Owner
Home Financials are based on the most recent Mortgage that was taken out on this home.
Original Mortgage
$131,000
Interest Rate
5.81%
Mortgage Type
Seller Take Back
Purchase Details
Closed on
Dec 30, 2003
Sold by
Naluai Michael L and Naluai Deborah D
Bought by
Roberts Rand E
Home Financials for this Owner
Home Financials are based on the most recent Mortgage that was taken out on this home.
Original Mortgage
$131,000
Interest Rate
5.81%
Mortgage Type
Seller Take Back
Purchase Details
Closed on
Sep 30, 2003
Sold by
Roberts Rand E
Bought by
Naluai Michael L and Naluai Deborah D
Purchase Details
Closed on
May 30, 2000
Sold by
Va
Bought by
Roberts Rand
Purchase Details
Closed on
Jul 12, 1994
Sold by
Levine Harriet
Bought by
Levine Harriet
Create a Home Valuation Report for This Property
The Home Valuation Report is an in-depth analysis detailing your home's value as well as a comparison with similar homes in the area
Home Values in the Area
Average Home Value in this Area
Purchase History
| Date | Buyer | Sale Price | Title Company |
|---|---|---|---|
| Ruiz Ramiro R | -- | -- | |
| Ruiz Ramiro R | $131,000 | -- | |
| Roberts Rand E | -- | -- | |
| Naluai Michael L | -- | -- | |
| Roberts Rand | -- | -- | |
| Levine Harriet | -- | -- |
Source: Public Records
Mortgage History
| Date | Status | Borrower | Loan Amount |
|---|---|---|---|
| Previous Owner | Ruiz Ramiro R | $131,000 |
Source: Public Records
Tax History
| Year | Tax Paid | Tax Assessment Tax Assessment Total Assessment is a certain percentage of the fair market value that is determined by local assessors to be the total taxable value of land and additions on the property. | Land | Improvement |
|---|---|---|---|---|
| 2025 | $2,292 | $176,303 | $52,891 | $123,412 |
| 2024 | $2,189 | $172,846 | $51,854 | $120,992 |
| 2023 | $2,187 | $169,457 | $50,837 | $118,620 |
| 2022 | $2,152 | $166,134 | $49,840 | $116,294 |
| 2021 | $2,186 | $162,877 | $48,863 | $114,014 |
| 2020 | $2,189 | $161,207 | $48,362 | $112,845 |
| 2019 | $2,133 | $158,046 | $47,414 | $110,632 |
| 2018 | $1,941 | $154,947 | $46,484 | $108,463 |
| 2017 | $1,872 | $151,909 | $45,573 | $106,336 |
| 2016 | $1,917 | $148,930 | $44,679 | $104,251 |
| 2015 | $1,854 | $146,693 | $44,008 | $102,685 |
| 2014 | $1,783 | $143,820 | $43,146 | $100,674 |
Source: Public Records
Map
Nearby Homes
- 10149 Alder Ave
- 9873 Alder Ave Unit 32
- 9873 Alder Ave Unit 4
- 17455 Marygold Ave Unit 49A
- 17455 Marygold Ave
- 17377 Valley Blvd Unit 19
- 17377 Valley Blvd
- 17377 Valley Blvd Unit 2
- 9850 Lombardy Ave
- 17400 Valley Blvd Unit 66
- 17400 Valley Blvd Unit 74
- 17400 Valley Blvd Unit 6
- 17333 Valley Blvd Unit 79
- 17333 Valley Blvd Unit 15E
- 17225 Valley Blvd Unit 9W
- 17333 Valley Blvd Unit 44E
- 17225 Valley Blvd
- 17333 Valley Blvd Unit 81E
- 17333 Valley Blvd Unit 36A
- 9847 Palmetto Ave
- 10171 Alder Ave
- 17726 Taylor Ave
- 17734 Taylor Ave
- 10160 Alder Ave
- 10148 Alder Ave
- 10132 Alder Ave
- 10176 Alder Ave
- 10198 Alder Ave
- 10191 Alder Ave
- 17691 Valley Blvd
- 17731 Taylor Ave
- 17743 Taylor Ave
- 17781 Valley Blvd
- 10230 Alder Ave
- 10233 Alder Ave
- 10569 Alder Ave
- 17732 Valley Blvd
- 17783 Taylor Ave
- 17796 Taylor Ave
- 10068 Alder Ave
Your Personal Tour Guide
Ask me questions while you tour the home.