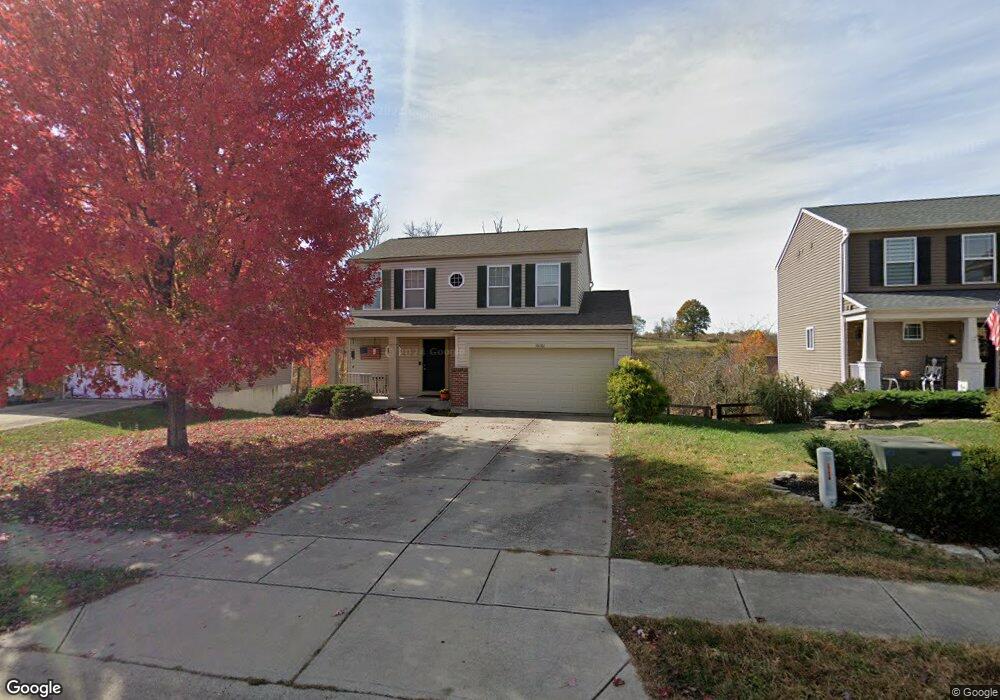
10161 Meadow Glen Dr Independence, KY 41051
Estimated Value: $328,000 - $341,000
3
Beds
3
Baths
1,599
Sq Ft
$210/Sq Ft
Est. Value
About This Home
This home is located at 10161 Meadow Glen Dr, Independence, KY 41051 and is currently estimated at $336,266, approximately $210 per square foot. 10161 Meadow Glen Dr is a home located in Kenton County with nearby schools including Simon Kenton High School, St. Cecilia Catholic School, and Zion Christian Academy.
Ownership History
Date
Name
Owned For
Owner Type
Purchase Details
Closed on
Sep 1, 2017
Sold by
Jordan Jeff and Jordan Lynda M
Bought by
Osterbrook Joshua
Current Estimated Value
Home Financials for this Owner
Home Financials are based on the most recent Mortgage that was taken out on this home.
Original Mortgage
$179,292
Outstanding Balance
$149,802
Interest Rate
3.92%
Mortgage Type
New Conventional
Estimated Equity
$186,464
Purchase Details
Closed on
Oct 6, 2009
Sold by
Maple Street Homes Llc
Bought by
Jordan Jeff
Home Financials for this Owner
Home Financials are based on the most recent Mortgage that was taken out on this home.
Original Mortgage
$145,966
Interest Rate
5.03%
Mortgage Type
FHA
Purchase Details
Closed on
Aug 5, 2009
Sold by
Wolsing Development Company Llc
Bought by
Maple Street Homes Llc
Create a Home Valuation Report for This Property
The Home Valuation Report is an in-depth analysis detailing your home's value as well as a comparison with similar homes in the area
Home Values in the Area
Average Home Value in this Area
Purchase History
| Date | Buyer | Sale Price | Title Company |
|---|---|---|---|
| Osterbrook Joshua | $177,500 | Kentucky Land Title Agency | |
| Jordan Jeff | $148,660 | Homestead Title Agency Ltd | |
| Maple Street Homes Llc | $34,709 | None Available |
Source: Public Records
Mortgage History
| Date | Status | Borrower | Loan Amount |
|---|---|---|---|
| Open | Osterbrook Joshua | $179,292 | |
| Previous Owner | Jordan Jeff | $145,966 |
Source: Public Records
Tax History Compared to Growth
Tax History
| Year | Tax Paid | Tax Assessment Tax Assessment Total Assessment is a certain percentage of the fair market value that is determined by local assessors to be the total taxable value of land and additions on the property. | Land | Improvement |
|---|---|---|---|---|
| 2024 | $2,669 | $217,900 | $48,000 | $169,900 |
| 2023 | $2,750 | $217,900 | $48,000 | $169,900 |
| 2022 | $2,808 | $217,900 | $48,000 | $169,900 |
| 2021 | $2,850 | $217,900 | $48,000 | $169,900 |
| 2020 | $2,384 | $177,500 | $40,000 | $137,500 |
| 2019 | $2,391 | $177,500 | $40,000 | $137,500 |
| 2018 | $2,404 | $177,500 | $40,000 | $137,500 |
| 2017 | $1,969 | $148,600 | $40,000 | $108,600 |
| 2015 | $1,911 | $148,600 | $34,700 | $113,900 |
| 2014 | $1,884 | $148,600 | $34,700 | $113,900 |
Source: Public Records
Map
Nearby Homes
- 10150 Meadow Glen Dr
- 1381 Poplartree Place
- 1375 Grandarbor Cir
- 1373 Meadowrun Ln
- 1355 Meadowcrest Cir
- Cumberland Plan at Meadow Glen - Maple Street Collection
- Wesley Plan at Meadow Glen - Maple Street Collection
- 10323 Manassas Ct
- 9972 Meadow Glen Dr
- 9947 Meadow Glen Dr
- 10311 Emancipation Place
- 10383 Lynchburg Dr
- 10363 Canberra Dr
- 10434 Sharpsburg Dr
- 1365 Cairns Ct
- 10438 Canberra Dr
- 10448 Canberra Dr
- 9831 Codyview Dr
- 570 Old Bristow Rd
- 114 Sylvan Dr
- 10157 Meadow Glen Dr
- 10157 Meadow Glen Dr
- 10157 Meadow Glen Dr Unit 198
- 10165 Meadow Glen Dr Unit 196
- 10153 Meadow Glen Dr
- 10153 Meadow Glen Dr Unit 199
- 10169 Meadow Glen Dr
- 10162 Meadow Glen Dr
- 10162 Meadow Glen Dr Unit 192
- 10173 Meadow Glen Dr
- 10173 Meadow Glen Dr Unit 132
- 10158 Meadow Glen Dr
- 10166 Meadow Glen Dr
- 10166 Meadow Glen Dr Unit 193
- 10170 Meadow Glen Dr Unit 194
- 10154 Meadow Glen Dr
- 10177 Meadow Glen Dr
- 10145 Meadow Glen Dr
- 10145 Meadow Glen Dr Unit 201
- 10174 Meadow Glen Dr