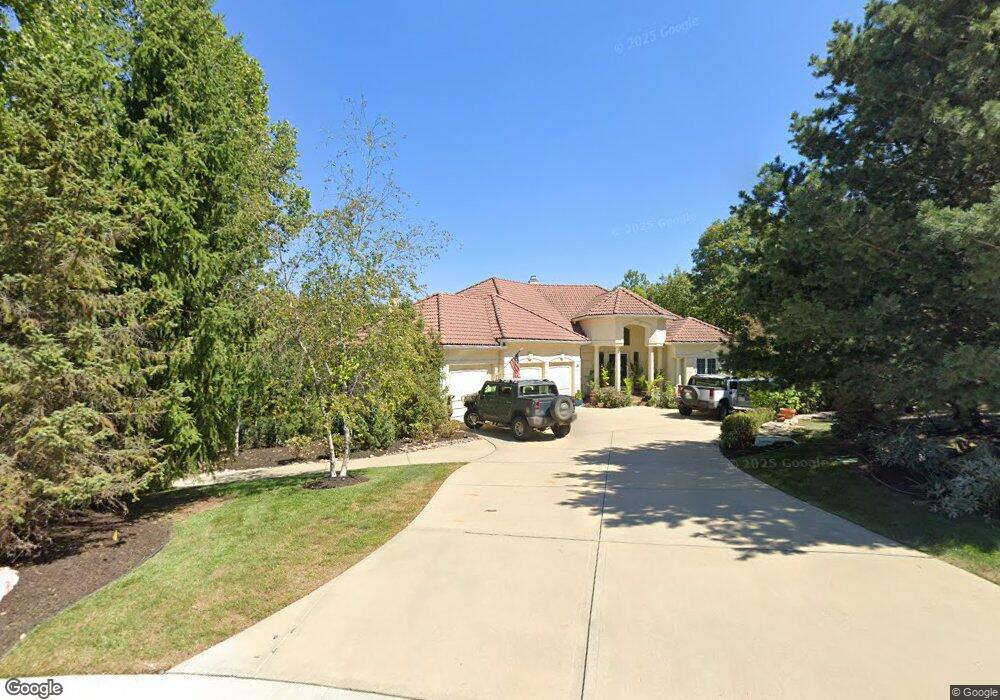
10161 S Highland Ln Olathe, KS 66061
Estimated Value: $991,000 - $1,342,000
4
Beds
4
Baths
2,800
Sq Ft
$430/Sq Ft
Est. Value
About This Home
This home is located at 10161 S Highland Ln, Olathe, KS 66061 and is currently estimated at $1,204,595, approximately $430 per square foot. 10161 S Highland Ln is a home located in Johnson County with nearby schools including Starside Elementary School, Lexington Trails Middle School, and De Soto High School.
Ownership History
Date
Name
Owned For
Owner Type
Purchase Details
Closed on
Oct 24, 2007
Sold by
Mcpeak Garold L and Mcpeak Mary L
Bought by
Mcpeak Garold L
Current Estimated Value
Purchase Details
Closed on
Apr 28, 2004
Sold by
Ben Cerra Construction Inc
Bought by
Mcpeak Garold L and Mcpeak Mary L
Home Financials for this Owner
Home Financials are based on the most recent Mortgage that was taken out on this home.
Original Mortgage
$200,000
Interest Rate
4.73%
Mortgage Type
Purchase Money Mortgage
Purchase Details
Closed on
May 22, 2003
Sold by
Cedar Creek Properties Inc
Bought by
Ben Cerra Construction Inc
Home Financials for this Owner
Home Financials are based on the most recent Mortgage that was taken out on this home.
Original Mortgage
$700,000
Interest Rate
5.65%
Mortgage Type
Purchase Money Mortgage
Create a Home Valuation Report for This Property
The Home Valuation Report is an in-depth analysis detailing your home's value as well as a comparison with similar homes in the area
Home Values in the Area
Average Home Value in this Area
Purchase History
| Date | Buyer | Sale Price | Title Company |
|---|---|---|---|
| Mcpeak Garold L | -- | None Available | |
| Mcpeak Garold L | -- | Security Land Title Company | |
| Ben Cerra Construction Inc | -- | Security Land Title Company |
Source: Public Records
Mortgage History
| Date | Status | Borrower | Loan Amount |
|---|---|---|---|
| Closed | Mcpeak Garold L | $200,000 | |
| Previous Owner | Ben Cerra Construction Inc | $700,000 |
Source: Public Records
Tax History Compared to Growth
Tax History
| Year | Tax Paid | Tax Assessment Tax Assessment Total Assessment is a certain percentage of the fair market value that is determined by local assessors to be the total taxable value of land and additions on the property. | Land | Improvement |
|---|---|---|---|---|
| 2024 | $14,777 | $130,433 | $34,208 | $96,225 |
| 2023 | $13,775 | $121,038 | $34,208 | $86,830 |
| 2022 | $13,241 | $114,092 | $34,208 | $79,884 |
| 2021 | $12,671 | $107,111 | $34,208 | $72,903 |
| 2020 | $12,172 | $102,385 | $34,208 | $68,177 |
| 2019 | $11,995 | $99,498 | $25,640 | $73,858 |
| 2018 | $11,746 | $96,531 | $22,295 | $74,236 |
| 2017 | $11,925 | $95,277 | $22,295 | $72,982 |
| 2016 | $11,243 | $88,700 | $18,582 | $70,118 |
| 2015 | $11,299 | $85,411 | $18,582 | $66,829 |
| 2013 | -- | $88,895 | $26,709 | $62,186 |
Source: Public Records
Map
Nearby Homes
- 10181 S Shadow Cir
- 10309 S Oakcrest Ln
- 26799 W Shadow Cir
- 27582 W Highland Cir
- 26650 W 100th Place
- 27596 W Highland Cir
- 10504 S Highland Ln
- The York Plan at Valley Ridge - Cedar Creek - Valley Ridge
- The Wyndham V Plan at Valley Ridge - Cedar Creek - Valley Ridge
- The Timberland Reverse Plan at Valley Ridge - Cedar Creek - Valley Ridge
- The Timberland Expanded Plan at Valley Ridge - Cedar Creek - Valley Ridge
- The Timberland Plan at Valley Ridge - Cedar Creek - Valley Ridge
- The Tatum Plan at Valley Ridge - Cedar Creek - Valley Ridge
- The Payton Plan at Valley Ridge - Cedar Creek - Valley Ridge
- The Morgan Plan at Valley Ridge - Cedar Creek - Valley Ridge
- The Mackenzie Plan at Valley Ridge - Cedar Creek - Valley Ridge
- The Landon II Plan at Valley Ridge - Cedar Creek - Valley Ridge
- The Landon Plan at Valley Ridge - Cedar Creek - Valley Ridge
- The Kylee Plan at Valley Ridge - Cedar Creek - Valley Ridge
- The Kinsley Plan at Valley Ridge - Cedar Creek - Valley Ridge
- 10171 S Highland Ln
- 10151 S Highland Ln
- 10166 S Highland Ln
- 10156 S Highland Ln
- 10181 S Highland Ln
- 10176 S Highland Ln
- 10191 S Highland Ln
- 10186 S Highland Ln
- 27090 W 102nd St
- 27157 W 100th Terrace
- 27133 W 100th Terrace
- 27181 W 115th Terrace
- 27109 100th Terrace
- 27120 W 102nd St
- 27205 W 100th Terrace
- 26973 W Shadow Cir
- 27229 W 100th Terrace
- 27080 W 102nd St
- 26995 W Shadow Cir
- 26951 W Shadow Cir