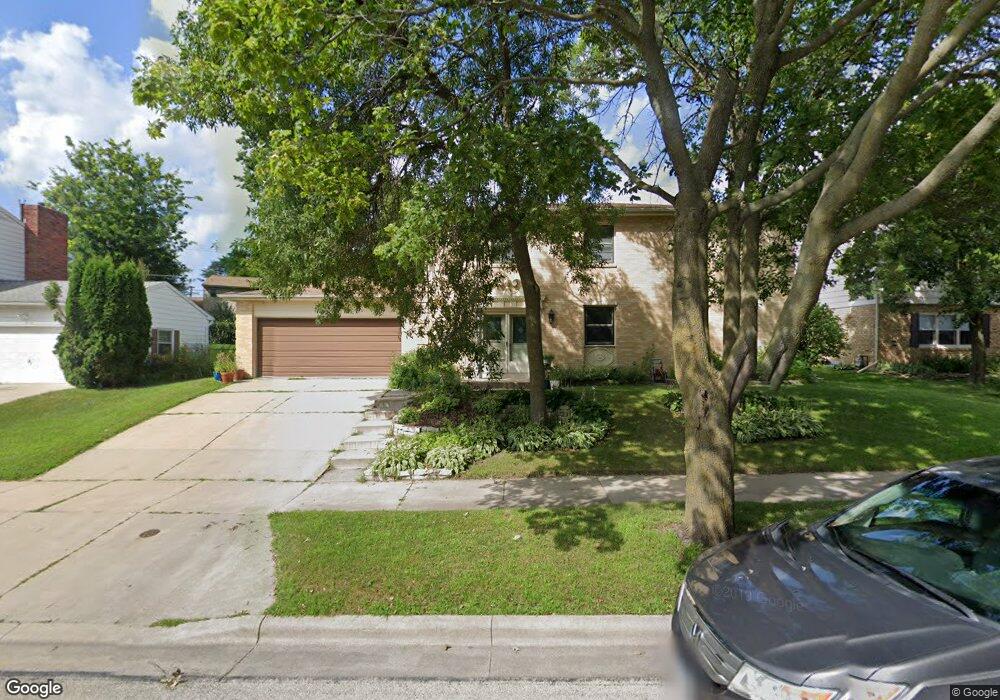
1017 19th St NE Rochester, MN 55906
Estimated Value: $373,000 - $419,000
5
Beds
3
Baths
3,188
Sq Ft
$124/Sq Ft
Est. Value
About This Home
This home is located at 1017 19th St NE, Rochester, MN 55906 and is currently estimated at $396,600, approximately $124 per square foot. 1017 19th St NE is a home located in Olmsted County with nearby schools including Churchill Elementary School, Hoover Elementary School, and Kellogg Middle School.
Ownership History
Date
Name
Owned For
Owner Type
Purchase Details
Closed on
May 20, 2021
Sold by
Rogerson Marvin C and Rogerson Jill W
Bought by
Devera Nicole De and Knudson Brianna
Current Estimated Value
Home Financials for this Owner
Home Financials are based on the most recent Mortgage that was taken out on this home.
Original Mortgage
$278,343
Outstanding Balance
$251,455
Interest Rate
2.9%
Mortgage Type
VA
Estimated Equity
$145,145
Purchase Details
Closed on
Jul 12, 2019
Sold by
Boyne Mary Ann
Bought by
Rogerson Marvin C and Rogerson Jill W
Home Financials for this Owner
Home Financials are based on the most recent Mortgage that was taken out on this home.
Original Mortgage
$251,750
Interest Rate
3.73%
Mortgage Type
New Conventional
Purchase Details
Closed on
Dec 8, 2017
Sold by
Boyne Mary Ann
Bought by
Boyne Mary Ann and Mary Ann Boyne Trust
Create a Home Valuation Report for This Property
The Home Valuation Report is an in-depth analysis detailing your home's value as well as a comparison with similar homes in the area
Home Values in the Area
Average Home Value in this Area
Purchase History
| Date | Buyer | Sale Price | Title Company |
|---|---|---|---|
| Devera Nicole De | $305,000 | Rochester Title & Escrow Co | |
| Rogerson Marvin C | $265,000 | Burnet Title | |
| Boyne Mary Ann | -- | None Available | |
| Boyne Mary Ann | -- | None Available | |
| Devera Nicole Nicole | $305,000 | -- |
Source: Public Records
Mortgage History
| Date | Status | Borrower | Loan Amount |
|---|---|---|---|
| Open | Devera Nicole De | $278,343 | |
| Previous Owner | Rogerson Marvin C | $251,750 | |
| Closed | Devera Nicole Nicole | $278,343 |
Source: Public Records
Tax History Compared to Growth
Tax History
| Year | Tax Paid | Tax Assessment Tax Assessment Total Assessment is a certain percentage of the fair market value that is determined by local assessors to be the total taxable value of land and additions on the property. | Land | Improvement |
|---|---|---|---|---|
| 2024 | $5,096 | $364,500 | $50,000 | $314,500 |
| 2023 | $4,302 | $341,600 | $50,000 | $291,600 |
| 2022 | $3,864 | $335,700 | $50,000 | $285,700 |
| 2021 | $3,528 | $290,500 | $50,000 | $240,500 |
| 2020 | $3,610 | $267,400 | $50,000 | $217,400 |
| 2019 | $3,402 | $263,100 | $23,600 | $239,500 |
| 2018 | $2,930 | $250,500 | $23,600 | $226,900 |
| 2017 | $2,930 | $223,500 | $23,600 | $199,900 |
| 2016 | $2,760 | $198,000 | $21,700 | $176,300 |
| 2015 | $1,287 | $182,200 | $21,400 | $160,800 |
| 2014 | $2,810 | $181,400 | $21,300 | $160,100 |
| 2012 | -- | $204,300 | $23,600 | $180,700 |
Source: Public Records
Map
Nearby Homes
- 2106 8th Ave NE
- 1723 Teton Ln NE
- 827 Sierra Ln NE
- 722 Northern Heights Dr NE
- 559 21st St NE
- 1561 11th Ave NE
- 2129 E Heights Ln NE
- 1703 19th St NE
- 1620 Northern Valley Dr NE
- 703 Northern Hills Dr NE
- 1411 14th St NE
- 1703 20th Ave NE
- 2522 Northern Hills Ct NE
- 1409 11th Ave NE
- 1251 19th Ave NE
- 783 26th St NE
- 1804 Northern Viola Ln NE
- 421 15th St NE
- 2708 Northern Valley Dr NE
- 2809 Northern Valley Dr NE
- 1025 19th St NE
- 1025 19th St NE
- 1009 19th St NE
- 1012 Northern Heights Dr NE
- 1025 1025 19th-Street-ne
- 1006 Northern Heights Dr NE
- 1018 Northern Heights Dr NE
- 1033 19th St NE
- 1003 19th St NE
- 1000 Northern Heights Dr NE
- 1010 19th St NE
- 1024 Northern Heights Dr NE
- 1026 19th St NE
- 1002 19th St NE
- 1105 19th St NE
- 939 19th St NE
- 1102 Northern Heights Dr NE
- 926 Northern Heights Dr NE
- 1102 19th St NE
- 938 19th St NE