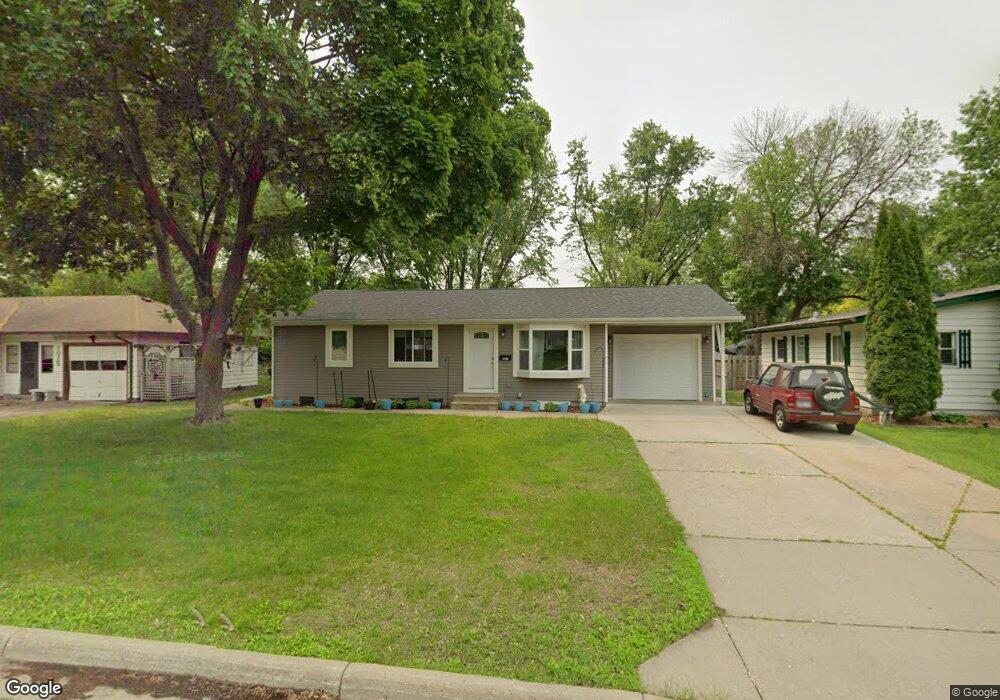
1017 3rd St W Hastings, MN 55033
Hastings-Marshan Township NeighborhoodEstimated Value: $324,532 - $345,000
4
Beds
2
Baths
1,856
Sq Ft
$179/Sq Ft
Est. Value
About This Home
This home is located at 1017 3rd St W, Hastings, MN 55033 and is currently estimated at $331,383, approximately $178 per square foot. 1017 3rd St W is a home located in Dakota County with nearby schools including Hastings Middle School, Christa Mcauliffe Elementary School, and Hastings High School.
Ownership History
Date
Name
Owned For
Owner Type
Purchase Details
Closed on
Apr 21, 2022
Sold by
Passe Andrea
Bought by
Hosch Jeffrey and Hosch Jessica
Current Estimated Value
Home Financials for this Owner
Home Financials are based on the most recent Mortgage that was taken out on this home.
Original Mortgage
$311,850
Outstanding Balance
$291,664
Interest Rate
3.85%
Mortgage Type
New Conventional
Estimated Equity
$39,719
Purchase Details
Closed on
Sep 27, 2017
Sold by
Pete & Nate Llc
Bought by
Passe Andrea
Home Financials for this Owner
Home Financials are based on the most recent Mortgage that was taken out on this home.
Original Mortgage
$223,870
Interest Rate
3.82%
Mortgage Type
Unknown
Purchase Details
Closed on
Jun 12, 2007
Sold by
Carlberg Angela
Bought by
Piskura Seth G and Piskura Jessica B
Create a Home Valuation Report for This Property
The Home Valuation Report is an in-depth analysis detailing your home's value as well as a comparison with similar homes in the area
Home Values in the Area
Average Home Value in this Area
Purchase History
| Date | Buyer | Sale Price | Title Company |
|---|---|---|---|
| Hosch Jeffrey | $315,000 | -- | |
| Passe Andrea | $228,000 | Ancona Title & Escrow | |
| Piskura Seth G | $186,000 | -- |
Source: Public Records
Mortgage History
| Date | Status | Borrower | Loan Amount |
|---|---|---|---|
| Open | Hosch Jeffrey | $311,850 | |
| Previous Owner | Passe Andrea | $223,870 | |
| Previous Owner | Passe Andrea | $223,870 |
Source: Public Records
Tax History Compared to Growth
Tax History
| Year | Tax Paid | Tax Assessment Tax Assessment Total Assessment is a certain percentage of the fair market value that is determined by local assessors to be the total taxable value of land and additions on the property. | Land | Improvement |
|---|---|---|---|---|
| 2024 | $2,958 | $266,200 | $64,100 | $202,100 |
| 2023 | $2,958 | $266,900 | $64,200 | $202,700 |
| 2022 | $2,330 | $263,600 | $64,100 | $199,500 |
| 2021 | $2,204 | $204,600 | $55,700 | $148,900 |
| 2020 | $2,252 | $193,900 | $53,100 | $140,800 |
| 2019 | $2,189 | $191,700 | $50,500 | $141,200 |
| 2018 | $2,016 | $178,800 | $48,100 | $130,700 |
| 2017 | $1,832 | $162,200 | $45,800 | $116,400 |
| 2016 | $1,949 | $149,800 | $42,800 | $107,000 |
| 2015 | $1,853 | $130,729 | $35,291 | $95,438 |
| 2014 | -- | $124,843 | $33,583 | $91,260 |
| 2013 | -- | $103,370 | $29,008 | $74,362 |
Source: Public Records
Map
Nearby Homes
- 145x 4th St W
- 900 5th St W
- 822 5th St W
- 101 Farm St Unit A
- 404 Pleasant Dr
- 930 Lyn Way Unit 204
- 628 4th St W
- 626 6th St W
- 401 Whispering Ln
- 642 Pleasant Dr
- 515 5th St W
- 1404 Featherstone Rd
- 300 Whispering Ln Unit 201
- 1306 Lincoln Ln
- 1221 14th St W
- 1227 14th St W
- 1100 Honeysuckle Ln
- 317 3rd St W
- 306 5th St W
- 302 3rd St W