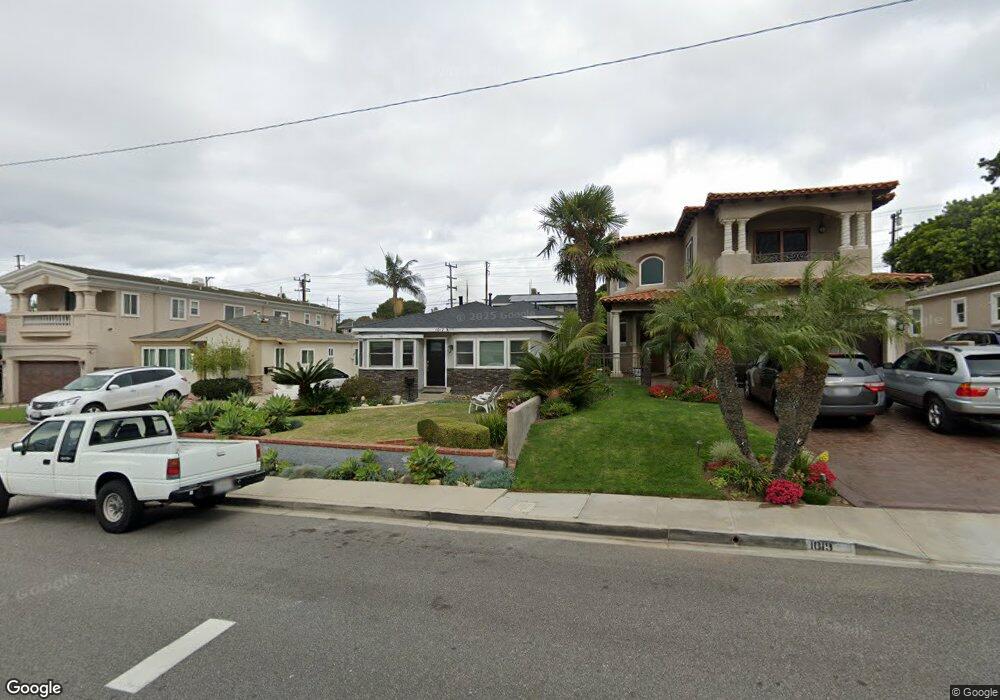
1017 Avenue A Redondo Beach, CA 90277
Estimated Value: $1,649,000 - $2,232,000
4
Beds
4
Baths
1,978
Sq Ft
$1,009/Sq Ft
Est. Value
About This Home
This home is located at 1017 Avenue A, Redondo Beach, CA 90277 and is currently estimated at $1,996,061, approximately $1,009 per square foot. 1017 Avenue A is a home located in Los Angeles County with nearby schools including Alta Vista Elementary School, Parras (Nick G.) Middle School, and Redondo Union High School.
Ownership History
Date
Name
Owned For
Owner Type
Purchase Details
Closed on
Dec 20, 2021
Sold by
Judith A Saunders Living Trust and Judith A Saunders Living Trust
Bought by
Judith A Saunders Living Trust and Saunders
Current Estimated Value
Home Financials for this Owner
Home Financials are based on the most recent Mortgage that was taken out on this home.
Original Mortgage
$0
Interest Rate
3.11%
Mortgage Type
Purchase Money Mortgage
Purchase Details
Closed on
Aug 26, 1999
Sold by
Saunders Judith A
Bought by
Saunders Judith A and The Judith A Saunders Living T
Purchase Details
Closed on
Jan 15, 1999
Sold by
Saunders Judith
Bought by
Saunders Judith A and The Judith A Saunders Living T
Purchase Details
Closed on
Oct 4, 1994
Sold by
Steinert Iva E
Bought by
Saunders Judith
Create a Home Valuation Report for This Property
The Home Valuation Report is an in-depth analysis detailing your home's value as well as a comparison with similar homes in the area
Home Values in the Area
Average Home Value in this Area
Purchase History
| Date | Buyer | Sale Price | Title Company |
|---|---|---|---|
| Judith A Saunders Living Trust | -- | New Title Company Name | |
| Saunders Judith A | -- | -- | |
| Saunders Judith A | -- | -- | |
| Saunders Judith A | -- | -- | |
| Saunders Judith | -- | -- |
Source: Public Records
Mortgage History
| Date | Status | Borrower | Loan Amount |
|---|---|---|---|
| Closed | Judith A Saunders Living Trust | $0 |
Source: Public Records
Tax History Compared to Growth
Tax History
| Year | Tax Paid | Tax Assessment Tax Assessment Total Assessment is a certain percentage of the fair market value that is determined by local assessors to be the total taxable value of land and additions on the property. | Land | Improvement |
|---|---|---|---|---|
| 2025 | $3,762 | $221,323 | $69,351 | $151,972 |
| 2024 | $3,762 | $216,985 | $67,992 | $148,993 |
| 2023 | $3,711 | $212,731 | $66,659 | $146,072 |
| 2022 | $3,583 | $208,560 | $65,352 | $143,208 |
| 2021 | $3,525 | $204,471 | $64,071 | $140,400 |
| 2020 | $3,478 | $202,376 | $63,415 | $138,961 |
| 2019 | $3,380 | $198,409 | $62,172 | $136,237 |
| 2018 | $6,721 | $194,519 | $60,953 | $133,566 |
| 2016 | $3,070 | $186,968 | $58,587 | $128,381 |
| 2015 | $3,028 | $184,160 | $57,707 | $126,453 |
| 2014 | $2,990 | $180,553 | $56,577 | $123,976 |
Source: Public Records
Map
Nearby Homes
- 904 Knob Hill Ave
- 1003 S Prospect Ave
- 1007 S Prospect Ave
- 1011 S Prospect Ave
- 1108 Camino Real Unit 306
- 1108 Camino Real Unit 409
- 703 Avenue D
- 22430 Susana Ave
- 641 S Prospect Ave Unit 103
- 635 S Prospect Ave Unit 103
- 824 Camino Real Unit 106
- 830 Camino Real Unit 201
- 824 Camino Real Unit 101
- 810 Camino Real Unit 104
- 603 S Prospect Ave Unit 205
- 603 S Prospect Ave Unit 305
- 1227 S Irena Ave
- 5608 Palos Verdes Blvd
- 1209 S Helberta Ave
- 619 Camino Real
- 1019 Avenue A
- 1015 Avenue A
- 1021 Avenue A
- 1013 Avenue A
- 1023 Avenue A
- 1011 Avenue A
- 916 Knob Hill Ave
- 1025 Avenue A
- 1009 Avenue A
- 914 Knob Hill Ave
- 918 Knob Hill Ave
- 912 Knob Hill Ave
- 920 Knob Hill Ave
- 910 Knob Hill Ave
- 1027 Avenue A
- 1007 Avenue A
- 922 Knob Hill Ave
- 1018 Avenue A
- 908 Knob Hill Ave
- 1016 Avenue A Unit 1030