
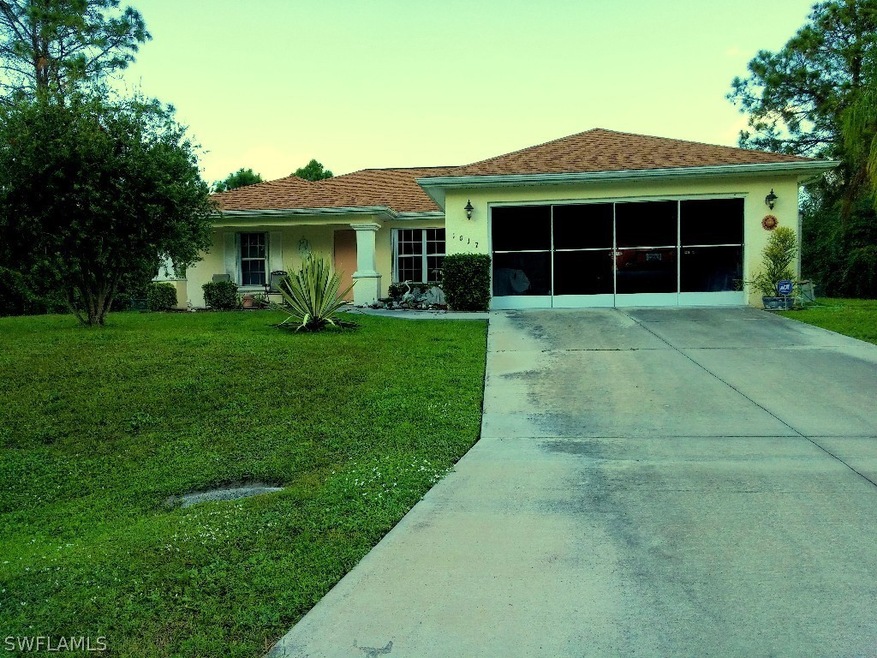

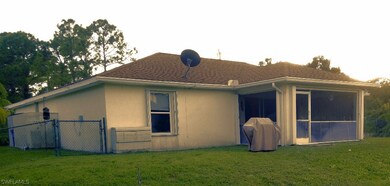
1017 Binkley St E Lehigh Acres, FL 33974
Eisenhower Neighborhood
3
Beds
2
Baths
1,401
Sq Ft
0.26
Acres
Highlights
- Waterfront
- Canal View
- No HOA
- Canal Access
- Fruit Trees
- Shutters
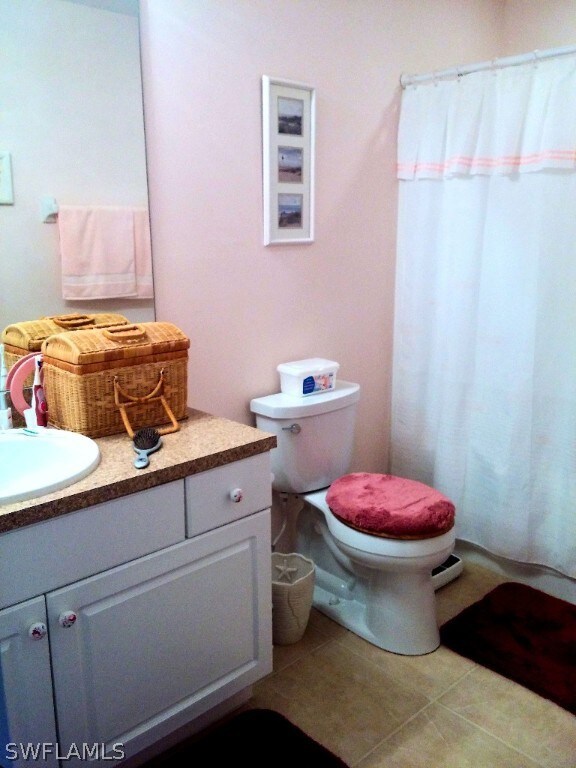
About This Home
As of August 2021Truly Move-in ready 3/2/2 on a canal. The yard is already fenced. AC replaced in 2014, Water Treatment upgraded in 2014, both are already caged in and maintained. There is a workbench and shelving in the garage, 2 sheds, and lots of fruit tree's. This is a very nice home and there are 3 lots across the street for sale so you can maintain the privacy! Shutters all around provide a nice discount on insurance. This home has been professionally painted inside and includes touch-up paint in each neutral color. The new fridge has the RO water for cold drinking water and good ice. Some of the high end furnishings are negotiable. Schedule your private viewing today and call this one Home!
Last Agent to Sell the Property
Coldwell Banker Preferred Properties License #396527725
Home Details
Home Type
- Single Family
Est. Annual Taxes
- $845
Year Built
- Built in 2006
Lot Details
- 0.26 Acre Lot
- Lot Dimensions are 90 x 125 x 90 x 125
- Waterfront
- South Facing Home
- Rectangular Lot
- Fruit Trees
- Property is zoned RS-1
Parking
- 2 Car Attached Garage
- Garage Door Opener
Home Design
- Shingle Roof
- Stucco
Interior Spaces
- 1,401 Sq Ft Home
- 1-Story Property
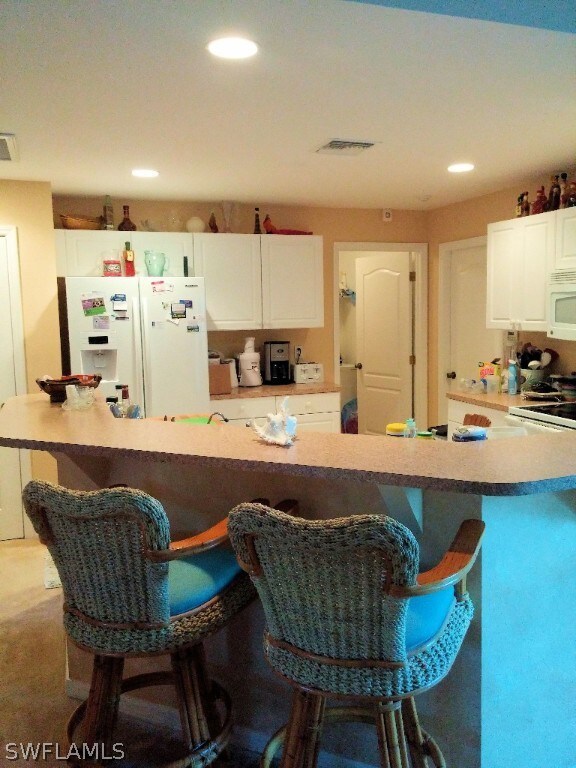
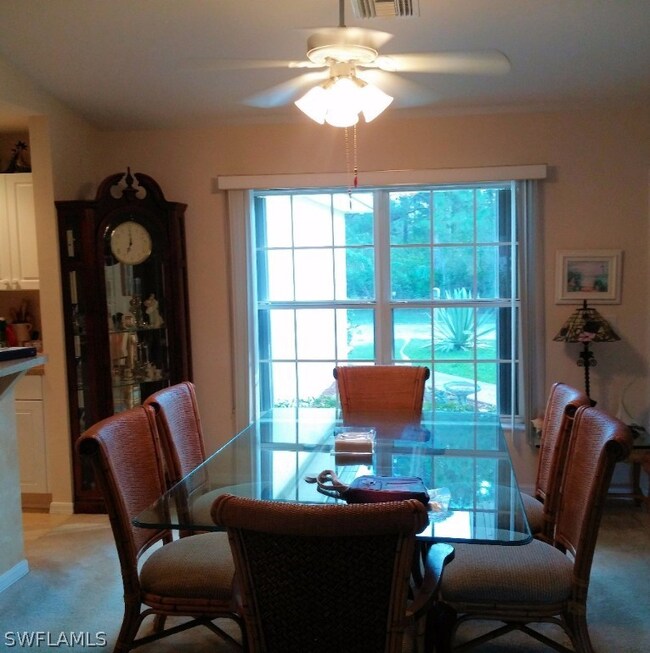
- Furnished or left unfurnished upon request
- Shutters
- Single Hung Windows
- Combination Dining and Living Room
- Canal Views
- Security System Owned
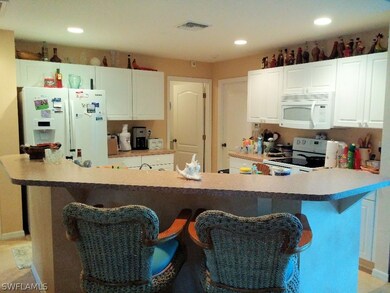
Kitchen
- Range
- Microwave
- Ice Maker
- Dishwasher
Flooring
- Carpet
- Tile
Bedrooms and Bathrooms
- 3 Bedrooms
- Split Bedroom Floorplan
- 2 Full Bathrooms
- Bathtub with Shower
Laundry
- Dryer
- Washer
Outdoor Features
- Canal Access
- Screened Patio
- Porch
Utilities
- Central Heating and Cooling System
- Well
- Water Purifier
- Septic Tank
Community Details
- No Home Owners Association
- Lehigh Acres Subdivision
Listing and Financial Details
- Legal Lot and Block 25 / 56
- Assessor Parcel Number 02-45-27-09-00056.0250
Ownership History
Date
Name
Owned For
Owner Type
Purchase Details
Listed on
May 10, 2021
Closed on
Jun 21, 2021
Sold by
Heath M Suzie and The M Suzie Heath Rev Trust
Bought by
Tanila Management And Consulting Inc
Seller's Agent
Nancy Brown
Starlink Realty, Inc
Buyer's Agent
Dorka Hernandez
Universe Realty Group, Inc
List Price
$215,999
Sold Price
$235,000
Premium/Discount to List
$19,001
8.8%
Total Days on Market
13
Current Estimated Value
Home Financials for this Owner
Home Financials are based on the most recent Mortgage that was taken out on this home.
Estimated Appreciation
$66,288
Avg. Annual Appreciation
8.80%
Purchase Details
Closed on
Mar 16, 2021
Sold by
Heath M Suzie
Bought by
Heath M Suzie and M Suzie Heath Rev Trust
Purchase Details
Closed on
Nov 14, 2013
Sold by
Enos Manuel
Bought by
Enos Manuel and Enos Maryann
Purchase Details
Closed on
Feb 4, 2011
Sold by
Enos Manuel
Bought by
Enos Manuel and Manuel Enos Revocable Living Trust
Purchase Details
Closed on
Mar 19, 2010
Sold by
Colorado United Credit Union
Bought by
Enos Manuel
Purchase Details
Closed on
Mar 26, 2008
Sold by
Nunez Jorge
Bought by
Colorado United Cu
Purchase Details
Closed on
Oct 29, 2005
Sold by
K Hovnanian First Homes Llc
Bought by
Nunez Jorge
Home Financials for this Owner
Home Financials are based on the most recent Mortgage that was taken out on this home.
Original Mortgage
$224,365
Interest Rate
5.84%
Mortgage Type
Construction
Purchase Details
Closed on
Jun 8, 2005
Sold by
Longo Joseph and Longo Frances M
Bought by
First Home Builders Of Florida
Map
Create a Home Valuation Report for This Property
The Home Valuation Report is an in-depth analysis detailing your home's value as well as a comparison with similar homes in the area
Similar Homes in the area
Home Values in the Area
Average Home Value in this Area
Purchase History
| Date | Type | Sale Price | Title Company |
|---|---|---|---|
| Warranty Deed | $215,000 | Sandbar Title Llc | |
| Interfamily Deed Transfer | -- | None Available | |
| Interfamily Deed Transfer | -- | Attorney | |
| Interfamily Deed Transfer | -- | Attorney | |
| Corporate Deed | $55,000 | Srs Title Services Llc | |
| Warranty Deed | $126,000 | Srs Title Services Inc | |
| Warranty Deed | $91,500 | First Home Title | |
| Warranty Deed | $43,500 | First Home Title Inc |
Source: Public Records
Mortgage History
| Date | Status | Loan Amount | Loan Type |
|---|---|---|---|
| Previous Owner | $224,365 | Construction |
Source: Public Records
Property History
| Date | Event | Price | Change | Sq Ft Price |
|---|---|---|---|---|
| 08/09/2021 08/09/21 | Sold | $235,000 | +2.2% | $168 / Sq Ft |
| 05/27/2021 05/27/21 | Price Changed | $230,000 | +6.5% | $164 / Sq Ft |
| 05/18/2021 05/18/21 | Pending | -- | -- | -- |
| 05/10/2021 05/10/21 | For Sale | $215,999 | +72.8% | $154 / Sq Ft |
| 12/23/2015 12/23/15 | Sold | $125,000 | -3.8% | $89 / Sq Ft |
| 11/23/2015 11/23/15 | Pending | -- | -- | -- |
| 11/09/2015 11/09/15 | For Sale | $129,900 | -- | $93 / Sq Ft |
Source: Florida Gulf Coast Multiple Listing Service
Tax History
| Year | Tax Paid | Tax Assessment Tax Assessment Total Assessment is a certain percentage of the fair market value that is determined by local assessors to be the total taxable value of land and additions on the property. | Land | Improvement |
|---|---|---|---|---|
| 2024 | $3,040 | $224,003 | $12,392 | $206,990 |
| 2023 | $3,445 | $218,951 | $0 | $0 |
| 2022 | $3,040 | $199,046 | $9,396 | $189,650 |
| 2021 | $2,359 | $142,860 | $6,319 | $136,541 |
| 2020 | $2,289 | $134,036 | $3,750 | $130,286 |
| 2019 | $2,258 | $128,388 | $3,700 | $124,688 |
| 2018 | $2,096 | $113,857 | $3,700 | $110,157 |
| 2017 | $2,020 | $112,248 | $4,000 | $108,248 |
| 2016 | $1,835 | $94,223 | $5,605 | $88,618 |
| 2015 | $880 | $79,804 | $4,343 | $75,461 |
| 2014 | -- | $71,497 | $4,005 | $67,492 |
| 2013 | -- | $59,806 | $3,576 | $56,230 |
Source: Public Records
Source: Florida Gulf Coast Multiple Listing Service
MLS Number: 215063399
APN: 02-45-27-L3-09056.0250
Disclaimer: Certain information contained herein is derived from information provided by parties other than Homes.com. All information provided is deemed reliable, but is not guaranteed to be accurate and should be independently verified.
![]() The information is being provided by Southwest Florida Multiple Listing Service. Information deemed reliable but not guaranteed. Information is provided for consumers' personal, non-commercial use, and may not be used for any purpose other than the identification of potential properties for purchase. Copyright 2025 Southwest Florida Multiple Listing Service. All Rights Reserved
The information is being provided by Southwest Florida Multiple Listing Service. Information deemed reliable but not guaranteed. Information is provided for consumers' personal, non-commercial use, and may not be used for any purpose other than the identification of potential properties for purchase. Copyright 2025 Southwest Florida Multiple Listing Service. All Rights Reserved
Nearby Homes
- 1018 Binkley St E
- 1027 Binkley St E
- 224 Callaway Ave
- 229 Mcarthur Blvd
- 1017 Barcelona St E
- 1026 Barcelona St E
- 228 Callaway Ave
- 1021 Barcelona St E
- 229 Bowman Ave S
- 1035 Belmont St E
- 947 Barcelona St E
- 1039 Binkley St E
- 1039 Camden St E
- 1063 Sunrise Blvd Unit 13
- 1039 Belmont St E
- 242 Callaway Ave
- 1040 Barcelona St E
- 178 Mcarthur Blvd
- 1022 Bagget St E
- 942 Sunrise Blvd