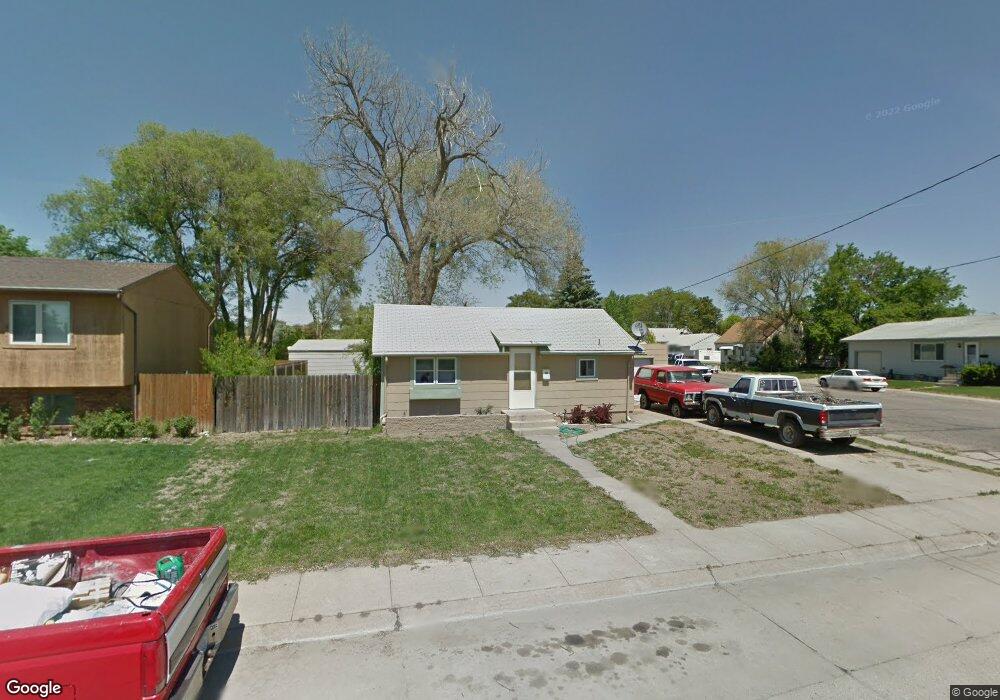
1017 E 4th St Ogallala, NE 69153
Estimated Value: $100,000 - $172,000
2
Beds
1
Bath
682
Sq Ft
$199/Sq Ft
Est. Value
About This Home
This home is located at 1017 E 4th St, Ogallala, NE 69153 and is currently estimated at $135,752, approximately $199 per square foot. 1017 E 4th St is a home with nearby schools including Ogallala High School, St. Luke's Elementary School, and St. Paul's Lutheran School.
Ownership History
Date
Name
Owned For
Owner Type
Purchase Details
Closed on
Mar 15, 2024
Sold by
L & M Rentals Llc
Bought by
Asap Rentals Llc
Current Estimated Value
Home Financials for this Owner
Home Financials are based on the most recent Mortgage that was taken out on this home.
Original Mortgage
$200,000
Outstanding Balance
$196,283
Interest Rate
6.63%
Mortgage Type
Credit Line Revolving
Estimated Equity
-$60,531
Purchase Details
Closed on
Nov 1, 2016
Sold by
Zeller Classic Rentals Llc
Bought by
L & M Rentals Llc
Create a Home Valuation Report for This Property
The Home Valuation Report is an in-depth analysis detailing your home's value as well as a comparison with similar homes in the area
Home Values in the Area
Average Home Value in this Area
Purchase History
| Date | Buyer | Sale Price | Title Company |
|---|---|---|---|
| Asap Rentals Llc | $300,000 | Premier Abstract & Title | |
| L & M Rentals Llc | $28,000 | Title Services Of The Plains |
Source: Public Records
Mortgage History
| Date | Status | Borrower | Loan Amount |
|---|---|---|---|
| Open | Asap Rentals Llc | $200,000 |
Source: Public Records
Tax History
| Year | Tax Paid | Tax Assessment Tax Assessment Total Assessment is a certain percentage of the fair market value that is determined by local assessors to be the total taxable value of land and additions on the property. | Land | Improvement |
|---|---|---|---|---|
| 2025 | $775 | $72,760 | $12,460 | $60,300 |
| 2024 | $776 | $72,630 | $12,460 | $60,170 |
| 2023 | $905 | $64,830 | $10,385 | $54,445 |
| 2022 | $808 | $50,990 | $8,460 | $42,530 |
| 2021 | $781 | $47,725 | $8,460 | $39,265 |
| 2020 | $659 | $39,890 | $8,460 | $31,430 |
| 2019 | $631 | $36,535 | $7,690 | $28,845 |
| 2018 | $596 | $33,835 | $7,690 | $26,145 |
| 2017 | $586 | $33,125 | $7,690 | $25,435 |
| 2016 | $603 | $33,125 | $7,690 | $25,435 |
| 2015 | $588 | $29,940 | $6,410 | $23,530 |
| 2010 | -- | $32,555 | $6,410 | $26,145 |
Source: Public Records
Map
Nearby Homes
Your Personal Tour Guide
Ask me questions while you tour the home.