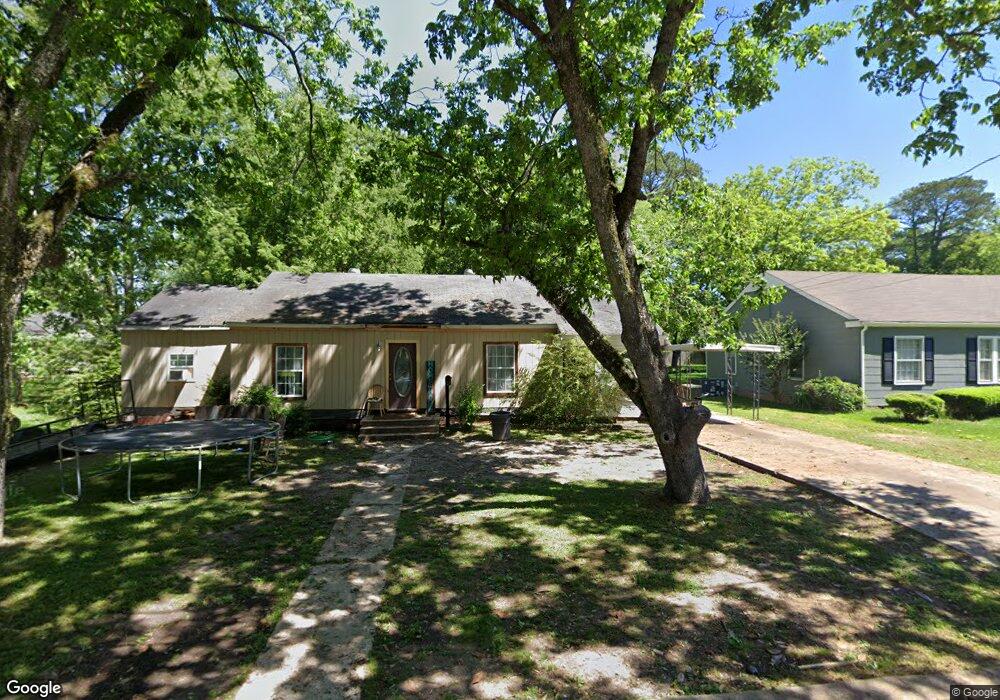
1017 E Westbrook St West Point, MS 39773
Estimated Value: $95,000 - $138,000
2
Beds
--
Bath
1,414
Sq Ft
$78/Sq Ft
Est. Value
About This Home
This home is located at 1017 E Westbrook St, West Point, MS 39773 and is currently estimated at $109,788, approximately $77 per square foot. 1017 E Westbrook St is a home located in Clay County with nearby schools including East Side Elementary School, West Clay Elementary School, and Church Hill Elementary School.
Ownership History
Date
Name
Owned For
Owner Type
Purchase Details
Closed on
Feb 9, 2022
Sold by
H L & C-Clay Llc
Bought by
Thompson Melisa C
Current Estimated Value
Purchase Details
Closed on
Jul 15, 2021
Sold by
Boaz Tax Sale Properties Llc
Bought by
Hl & C Clay Llc
Purchase Details
Closed on
Jul 30, 2019
Sold by
Paulette Properties Llc
Bought by
Southern Retail Development Llc
Purchase Details
Closed on
Jul 24, 2017
Sold by
Realty Income Corp
Bought by
Lin Yan and Lin Choa Hong
Create a Home Valuation Report for This Property
The Home Valuation Report is an in-depth analysis detailing your home's value as well as a comparison with similar homes in the area
Purchase History
| Date | Buyer | Sale Price | Title Company |
|---|---|---|---|
| Thompson Melisa C | -- | None Listed On Document | |
| Hl & C Clay Llc | -- | None Listed On Document | |
| Hl & C Clay Codnty Llc | -- | None Listed On Document | |
| Hl & C Clay County Llc | -- | None Available | |
| Hl & C Clay County Llc | -- | None Available | |
| Southern Retail Development Llc | -- | -- | |
| Southern Retail Development Llc | -- | -- | |
| Lin Yan | -- | -- |
Source: Public Records
Tax History
| Year | Tax Paid | Tax Assessment Tax Assessment Total Assessment is a certain percentage of the fair market value that is determined by local assessors to be the total taxable value of land and additions on the property. | Land | Improvement |
|---|---|---|---|---|
| 2025 | $461 | $8,509 | $1,854 | $6,655 |
| 2024 | $461 | $8,509 | $1,854 | $6,655 |
| 2023 | $1,098 | $7,333 | $1,854 | $5,479 |
| 2022 | $400 | $7,333 | $1,854 | $5,479 |
| 2021 | $399 | $7,333 | $1,854 | $5,479 |
| 2020 | $399 | $7,333 | $1,854 | $5,479 |
| 2019 | $376 | $7,282 | $1,854 | $5,428 |
| 2018 | $361 | $7,282 | $1,854 | $5,428 |
| 2017 | $361 | $7,282 | $1,854 | $5,428 |
| 2016 | $347 | $7,282 | $1,854 | $5,428 |
| 2015 | -- | $4,483 | $1,236 | $3,247 |
| 2014 | -- | $4,483 | $1,236 | $3,247 |
| 2013 | -- | $4,483 | $1,236 | $3,247 |
Source: Public Records
Map
Nearby Homes
- 551 E Westbrook St
- 341 Mccord St
- 26596 E Main St
- 27045 E Main St
- 913 E Westbrook St
- 228 Mccord St
- 26852 E Main St
- 507 S Eshman Ave
- 26788 E Main St
- 105 Converse Dr
- 238 Calhoun St
- 472 S Eshman Ave
- 1046 E Brame Ave
- 405 S Eshman Ave
- 44 Torbert Dr
- 278 Converse Dr
- 329 Converse Dr
- 761 E Morrow St
- 184 Tournament St
- 530 E Morrow St
- 1025 E Westbrook St
- 1030 E Westbrook St
- 1001 E Westbrook St
- 1031 E Westbrook St
- 1042 E Westbrook St
- 442 Miller Ave
- 1048 E Westbrook St
- 1007 E Westbrook St
- 1020 E Westbrook St
- 404 Miller Ave
- 1037 E Westbrook St
- 326 Miller Ave
- 1045 E Westbrook St
- 1054 E Westbrook St
- 742 E Westbrook St
- 973 E Westbrook St
- 1058 E Westbrook St
- 1008 E Broad St
- 1016 E Broad St
- 314 Miller Ave
Your Personal Tour Guide
Ask me questions while you tour the home.