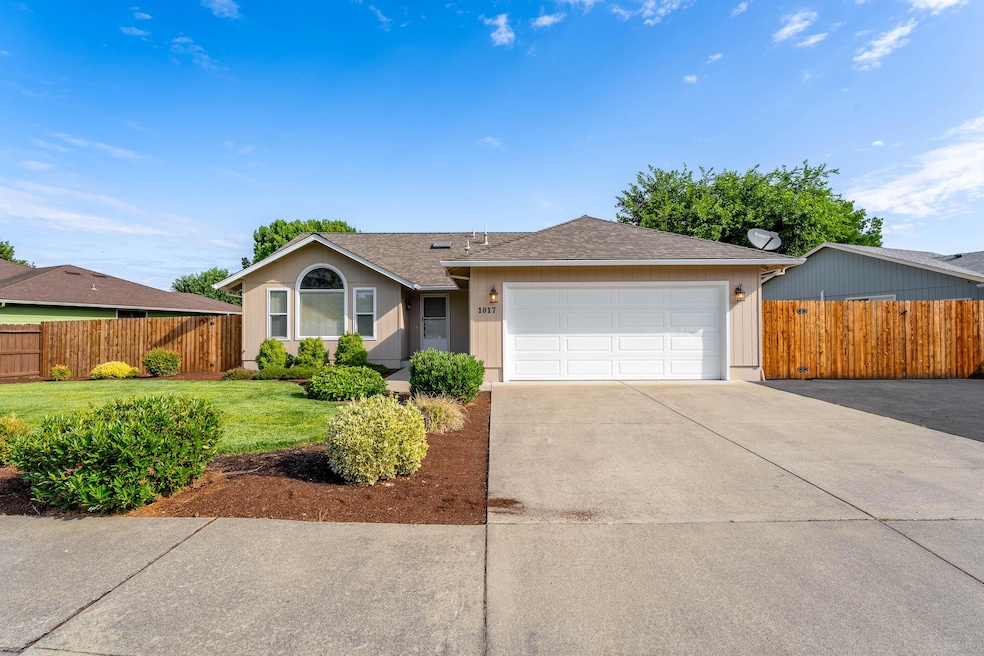
1017 Fairfield Ave Central Point, OR 97502
Estimated payment $2,504/month
Highlights
- RV Access or Parking
- Territorial View
- No HOA
- Contemporary Architecture
- Vaulted Ceiling
- 2-minute walk to B.F Egypt
About This Home
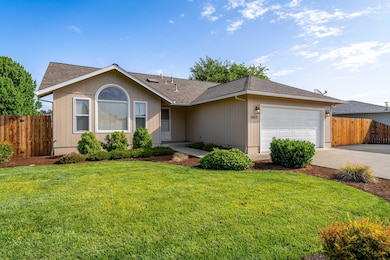
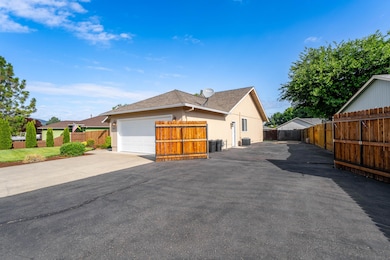
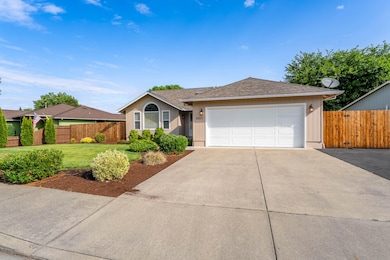
Move-in ready and impeccably maintained, this immaculate home is just waiting for your personal touches. Featuring brand new flooring and a beautifully remodeled primary bathroom, the home has been lovely cared for. The exterior has been freshly painted giving a crisp curb appeal. This charming single level residence offers three bedrooms, two bathrooms and stylish finishes throughout, including
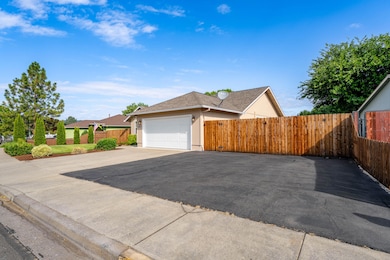
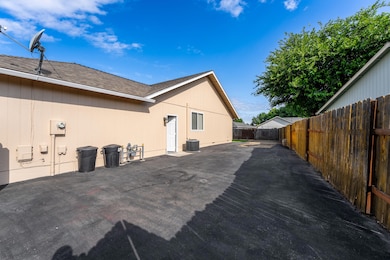
stainless steel appliances and classic white tile. Outside, the property provides ample space for all your recreational needs, including room to park a large RV or boat. Equipped with 120 amp electrical hook ups the designated parking area is 22 feet wide and extends well beyond 55 feet in length ideal for extra vehicles or outdoor storage
Listing Agent
John L Scott Real Estate Grants Pass Brokerage Phone: 541-476-1299 License #200108144 Listed on: 09/25/2025

Home Details
Home Type
- Single Family
Est. Annual Taxes
- $3,437
Year Built
- Built in 1997
Lot Details
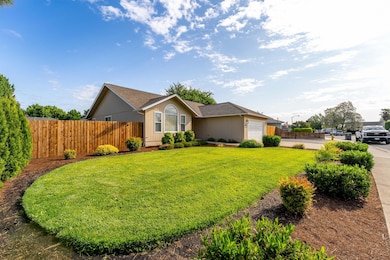
- 8,712 Sq Ft Lot
- Landscaped
- Level Lot
- Property is zoned R-1-6, R-1-6
Parking
- 2 Car Attached Garage
- Driveway
- RV Access or Parking
Home Design
- Contemporary Architecture
- Block Foundation
- Composition Roof
Interior Spaces
- 1,473 Sq Ft Home
- 1-Story Property
- Vaulted Ceiling
- Double Pane Windows
- Living Room
- Dining Room
- Territorial Views
- Laundry Room
Kitchen
- Oven
- Range with Range Hood
- Dishwasher
- Tile Countertops
Flooring
- Carpet
- Laminate
Bedrooms and Bathrooms
- 3 Bedrooms
- Walk-In Closet
- 2 Full Bathrooms
- Bathtub with Shower
Home Security
- Carbon Monoxide Detectors
- Fire and Smoke Detector
Outdoor Features
- Covered Patio or Porch
Schools
- Central Point Elementary School
- Scenic Middle School
- Crater High School
Utilities
- Cooling Available
- Forced Air Heating System
- Heating System Uses Natural Gas
- Heat Pump System
- Natural Gas Connected
- Water Heater
Community Details
- No Home Owners Association
- Forest Glen Phase I Subdivision
Listing and Financial Details
- Assessor Parcel Number 10875667
Map
Home Values in the Area
Average Home Value in this Area
Tax History
| Year | Tax Paid | Tax Assessment Tax Assessment Total Assessment is a certain percentage of the fair market value that is determined by local assessors to be the total taxable value of land and additions on the property. | Land | Improvement |
|---|---|---|---|---|
| 2025 | $3,438 | $206,760 | $71,010 | $135,750 |
| 2024 | $3,438 | $200,740 | $68,940 | $131,800 |
| 2023 | $3,327 | $194,900 | $66,930 | $127,970 |
| 2022 | $3,249 | $194,900 | $66,930 | $127,970 |
| 2021 | $3,157 | $189,230 | $64,980 | $124,250 |
| 2020 | $3,064 | $183,720 | $63,090 | $120,630 |
| 2019 | $2,989 | $173,180 | $59,480 | $113,700 |
| 2018 | $2,898 | $168,140 | $57,750 | $110,390 |
| 2017 | $2,825 | $168,140 | $57,750 | $110,390 |
| 2016 | $2,743 | $158,500 | $54,430 | $104,070 |
| 2015 | $2,628 | $158,500 | $54,430 | $104,070 |
| 2014 | $2,561 | $149,410 | $51,300 | $98,110 |
Property History
| Date | Event | Price | List to Sale | Price per Sq Ft |
|---|---|---|---|---|
| 11/14/2025 11/14/25 | Price Changed | $419,999 | -1.2% | $285 / Sq Ft |
| 09/25/2025 09/25/25 | For Sale | $424,999 | -- | $289 / Sq Ft |
Purchase History
| Date | Type | Sale Price | Title Company |
|---|---|---|---|
| Warranty Deed | $220,000 | Ticor Title Company Of Or | |
| Warranty Deed | $68,722 | Amerititle | |
| Warranty Deed | $145,000 | Amerititle | |
| Special Warranty Deed | $85,000 | Amerititle |
Mortgage History
| Date | Status | Loan Amount | Loan Type |
|---|---|---|---|
| Previous Owner | $216,015 | FHA | |
| Previous Owner | $68,690 | Purchase Money Mortgage |
Source: Oregon Datashare
MLS Number: 220209781
APN: 10875667
Disclaimer: Certain information contained herein is derived from information provided by parties other than Homes.com. All information provided is deemed reliable, but is not guaranteed to be accurate and should be independently verified.
![]() © 2025 Oregon Datashare (KCAR | MLSCO | SOMLS). All rights reserved. The data relating to real estate for sale on this web site comes in part from the Internet Data Exchange Program of the Oregon Datashare. Real estate listings held by IDX Brokerage firms other than Ten-X are marked with the Internet Data Exchange logo or the Internet Data Exchange thumbnail logo and detailed information about them includes the name of the listing Brokers. Information provided is for consumers' personal, non-commercial use and may not be used for any purpose other than to identify prospective properties the viewer may be interested in purchasing. The consumer will not copy, retransmit nor redistribute any of the content from this website. Information provided is deemed reliable, but not guaranteed.
© 2025 Oregon Datashare (KCAR | MLSCO | SOMLS). All rights reserved. The data relating to real estate for sale on this web site comes in part from the Internet Data Exchange Program of the Oregon Datashare. Real estate listings held by IDX Brokerage firms other than Ten-X are marked with the Internet Data Exchange logo or the Internet Data Exchange thumbnail logo and detailed information about them includes the name of the listing Brokers. Information provided is for consumers' personal, non-commercial use and may not be used for any purpose other than to identify prospective properties the viewer may be interested in purchasing. The consumer will not copy, retransmit nor redistribute any of the content from this website. Information provided is deemed reliable, but not guaranteed.
- 1060 Hopkins Rd
- 921 Pittview Ave
- 928 Brandi Way
- 851 Juanita Way
- 881 Westrop Dr
- 460 Federal Way
- 571 Briarwood Dr
- 3496 Edella St
- 1065 Edwina Ave
- 659 Herman Ave
- 745 Herman Ave
- 301 Freeman Rd Unit 100
- 301 Freeman Rd Unit 23
- 301 Freeman Rd Unit 85
- 230 Peninger Rd
- 555 Freeman Rd Unit 128
- 555 Freeman Rd Unit 146
- 555 Freeman Rd Unit 204
- 555 Freeman Rd Unit 209
- 1840 E Pine St
- 1125 Annalise St
- 700 N Haskell St
- 2190 Poplar Dr
- 1801 Poplar Dr
- 237 E McAndrews Rd
- 1116 Niantic St Unit 3
- 302 Maple St Unit 4
- 645 Royal Ave
- 518 N Riverside Ave
- 520 N Bartlett St
- 2642 W Main St
- 406 W Main St
- 835 Overcup St
- 121 S Holly St
- 230 Laurel St
- 309 Laurel St
- 534 Hamilton St Unit 534
- 536 Hamilton St Unit 536
- 2532 Juanipero Way
- 353 Dalton St