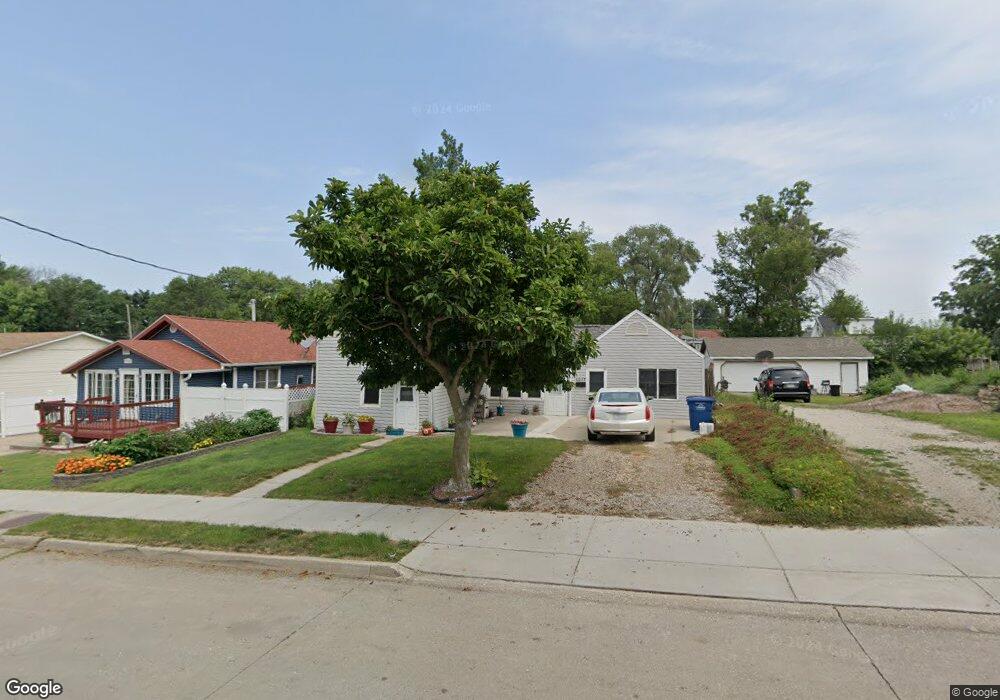
1017 Geil Ave Des Moines, IA 50315
Watrous South NeighborhoodEstimated Value: $153,582 - $193,000
3
Beds
1
Bath
927
Sq Ft
$181/Sq Ft
Est. Value
About This Home
This home is located at 1017 Geil Ave, Des Moines, IA 50315 and is currently estimated at $168,146, approximately $181 per square foot. 1017 Geil Ave is a home located in Polk County with nearby schools including Morris Elementary School, Mccombs Middle School, and Lincoln High School.
Ownership History
Date
Name
Owned For
Owner Type
Purchase Details
Closed on
Feb 27, 2001
Sold by
Quick Paul E and Quick Jennifer L
Bought by
Quick Paul E and Quick Jennifer L
Current Estimated Value
Home Financials for this Owner
Home Financials are based on the most recent Mortgage that was taken out on this home.
Original Mortgage
$55,800
Interest Rate
7.06%
Purchase Details
Closed on
Jul 9, 1999
Sold by
Quick Richard L and Quick Kathryn
Bought by
Quick Paul L and Richards Tina M
Create a Home Valuation Report for This Property
The Home Valuation Report is an in-depth analysis detailing your home's value as well as a comparison with similar homes in the area
Home Values in the Area
Average Home Value in this Area
Purchase History
| Date | Buyer | Sale Price | Title Company |
|---|---|---|---|
| Quick Paul E | -- | -- | |
| Quick Paul L | -- | -- |
Source: Public Records
Mortgage History
| Date | Status | Borrower | Loan Amount |
|---|---|---|---|
| Closed | Quick Paul E | $55,800 |
Source: Public Records
Tax History Compared to Growth
Tax History
| Year | Tax Paid | Tax Assessment Tax Assessment Total Assessment is a certain percentage of the fair market value that is determined by local assessors to be the total taxable value of land and additions on the property. | Land | Improvement |
|---|---|---|---|---|
| 2025 | $2,200 | $137,900 | $28,300 | $109,600 |
| 2024 | $2,200 | $122,300 | $24,700 | $97,600 |
| 2023 | $2,108 | $122,300 | $24,700 | $97,600 |
| 2022 | $2,090 | $98,300 | $20,200 | $78,100 |
| 2021 | $1,906 | $98,300 | $20,200 | $78,100 |
| 2020 | $1,976 | $85,000 | $17,400 | $67,600 |
| 2019 | $1,852 | $85,000 | $17,400 | $67,600 |
| 2018 | $1,828 | $77,400 | $15,500 | $61,900 |
| 2017 | $1,788 | $77,400 | $15,500 | $61,900 |
| 2016 | $1,736 | $74,600 | $14,700 | $59,900 |
| 2015 | $1,736 | $74,600 | $14,700 | $59,900 |
| 2014 | $1,736 | $76,700 | $14,800 | $61,900 |
Source: Public Records
Map
Nearby Homes
- 1029 Bundy St
- 1161 Bundy St
- 1225 West St
- 6205 SW 12th St
- 1115 Rittenhouse St
- 1214 Leland Ave
- 1313 Burnham Ave
- 1115 Wade St
- 1310 Leland Ave
- 1010 Frederick Ave
- 1210 Highview Dr
- 6107 SW 14th St
- 1010 Amos Ave
- 6001 SW 13th Place
- 6204 SW 5th St
- 1334 Wade St
- 1500 Leland Ave
- 1304 Wall Ave
- 214 Leland Ave
- 5812 SW 5th St