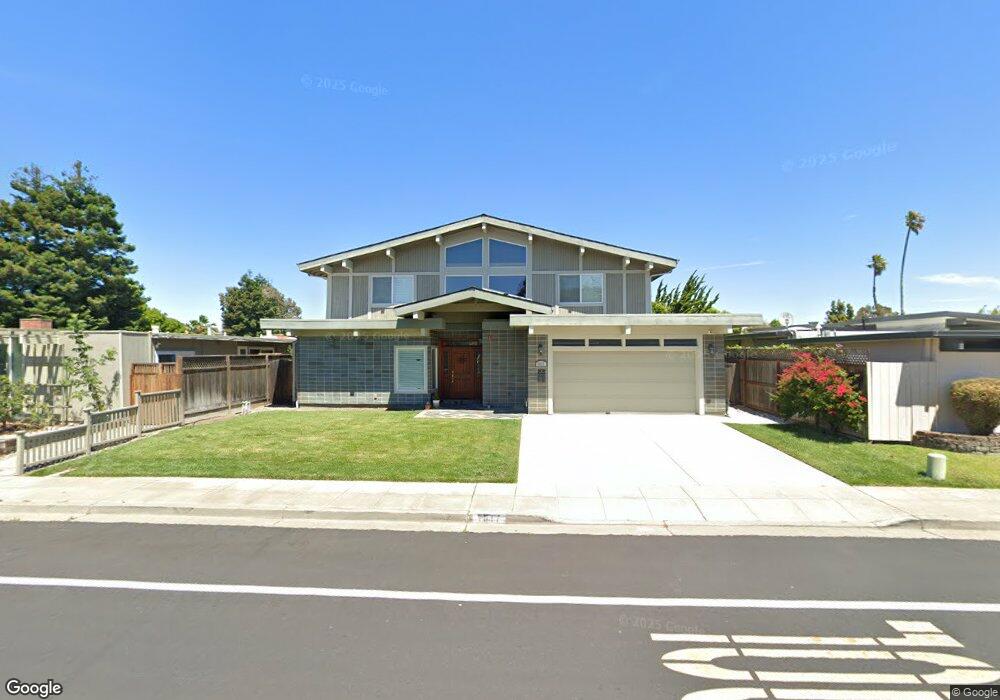
1017 Gull Ave Foster City, CA 94404
Bay Vista NeighborhoodEstimated Value: $2,419,000 - $2,725,000
4
Beds
4
Baths
2,744
Sq Ft
$961/Sq Ft
Est. Value
About This Home
This home is located at 1017 Gull Ave, Foster City, CA 94404 and is currently estimated at $2,636,437, approximately $960 per square foot. 1017 Gull Ave is a home located in San Mateo County with nearby schools including Audubon Elementary School, Bowditch Middle School, and San Mateo High School.
Ownership History
Date
Name
Owned For
Owner Type
Purchase Details
Closed on
Oct 19, 2022
Sold by
Pohontu Mihai and Pohontu Jiyeon
Bought by
Pohontu Family Trust and Pohontu
Current Estimated Value
Purchase Details
Closed on
Feb 12, 2010
Sold by
Lee Ki Hyun and Lee Tae Soog
Bought by
Pohontu Mihai and Kim Jiyeon
Home Financials for this Owner
Home Financials are based on the most recent Mortgage that was taken out on this home.
Original Mortgage
$729,750
Interest Rate
5.02%
Mortgage Type
New Conventional
Purchase Details
Closed on
Jun 15, 2006
Sold by
Wing Shirley
Bought by
Lee Ki Hyun and Lee Tae Soog
Home Financials for this Owner
Home Financials are based on the most recent Mortgage that was taken out on this home.
Original Mortgage
$276,500
Interest Rate
6.55%
Mortgage Type
Fannie Mae Freddie Mac
Purchase Details
Closed on
May 6, 1998
Sold by
Lawrence Walter H
Bought by
Lawrence Dorothy Y
Create a Home Valuation Report for This Property
The Home Valuation Report is an in-depth analysis detailing your home's value as well as a comparison with similar homes in the area
Home Values in the Area
Average Home Value in this Area
Purchase History
| Date | Buyer | Sale Price | Title Company |
|---|---|---|---|
| Pohontu Family Trust | -- | None Listed On Document | |
| Pohontu Mihai | $1,150,000 | Fidelity National Title Co | |
| Lee Ki Hyun | $553,000 | First American Title Company | |
| Lawrence Dorothy Y | -- | -- |
Source: Public Records
Mortgage History
| Date | Status | Borrower | Loan Amount |
|---|---|---|---|
| Previous Owner | Pohontu Mihai | $729,750 | |
| Previous Owner | Lee Ki Hyun | $276,500 |
Source: Public Records
Tax History Compared to Growth
Tax History
| Year | Tax Paid | Tax Assessment Tax Assessment Total Assessment is a certain percentage of the fair market value that is determined by local assessors to be the total taxable value of land and additions on the property. | Land | Improvement |
|---|---|---|---|---|
| 2025 | $17,195 | $1,484,432 | $742,216 | $742,216 |
| 2023 | $17,195 | $1,426,792 | $713,396 | $713,396 |
| 2022 | $16,620 | $1,398,816 | $699,408 | $699,408 |
| 2021 | $16,406 | $1,371,390 | $685,695 | $685,695 |
| 2020 | $15,955 | $1,357,330 | $678,665 | $678,665 |
| 2019 | $15,115 | $1,330,716 | $665,358 | $665,358 |
| 2018 | $14,553 | $1,304,624 | $652,312 | $652,312 |
| 2017 | $14,390 | $1,279,044 | $639,522 | $639,522 |
| 2016 | $14,301 | $1,253,966 | $626,983 | $626,983 |
| 2015 | $13,969 | $1,235,132 | $617,566 | $617,566 |
| 2014 | $13,614 | $1,210,938 | $605,469 | $605,469 |
Source: Public Records
Map
Nearby Homes
- 224 Loon Ct
- 1351 Marlin Ave
- 1074 Eagle Ln
- 1336 Marlin Ave
- 275 Puffin Ct
- 241 Bonita Ln
- 748 Gull Ave
- 650 Pilgrim Dr
- 3206 Admiralty Ln
- 1102 Admiralty Ln
- 591 Pilgrim Dr
- 370 Bramble Ct
- 708 Thayer Ln Unit 404
- 769 Eppleton Ln Unit 302
- 1028 Foster Square Ln Unit 305
- 1131 Compass Ln Unit 108
- 708 Eppleton Ln Unit 204
- 1081 Beach Park Blvd Unit 206
- 718 Eppleton Ln Unit 303
- 1061 Beach Park Blvd Unit 216