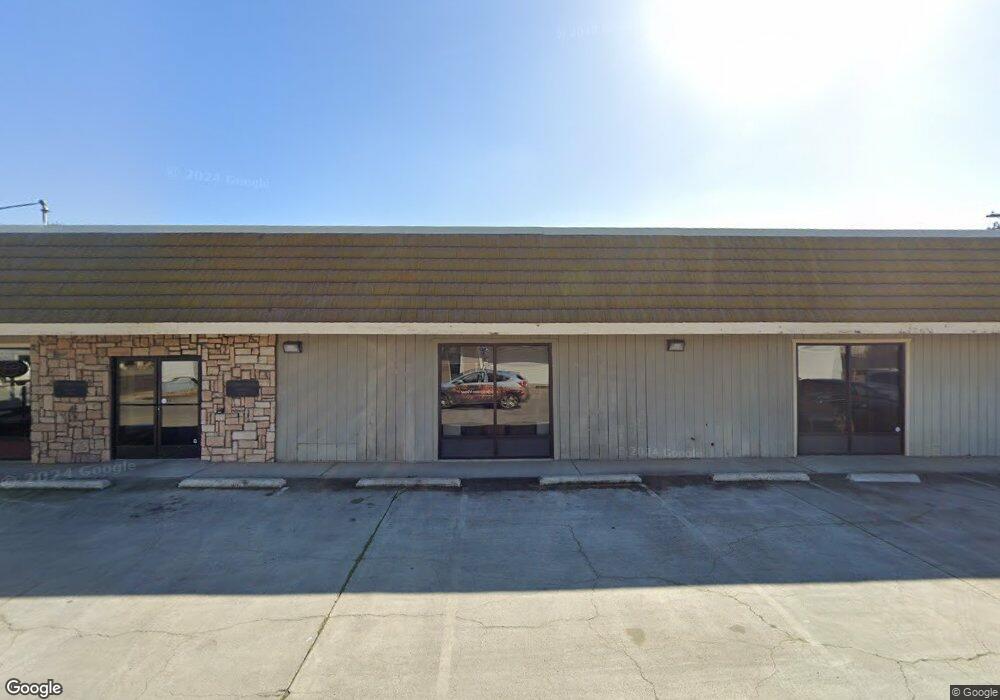
1017 I St Los Banos, CA 93635
Estimated Value: $1,044,931
Studio
--
Bath
--
Sq Ft
11,238
Sq Ft Lot
About This Home
This home is located at 1017 I St, Los Banos, CA 93635 and is currently estimated at $1,044,931. 1017 I St is a home located in Merced County with nearby schools including Los Banos Elementary School, Creekside Junior High School, and Los Banos High School.
Ownership History
Date
Name
Owned For
Owner Type
Purchase Details
Closed on
Oct 16, 2008
Sold by
M G Santos Inc
Bought by
Brehm Duane S and Brehm Judy C
Current Estimated Value
Home Financials for this Owner
Home Financials are based on the most recent Mortgage that was taken out on this home.
Original Mortgage
$300,000
Outstanding Balance
$193,064
Interest Rate
5.77%
Mortgage Type
Seller Take Back
Estimated Equity
$851,867
Purchase Details
Closed on
May 2, 2003
Sold by
Borba Bob and Borba Sharon
Bought by
M G Santos Inc
Create a Home Valuation Report for This Property
The Home Valuation Report is an in-depth analysis detailing your home's value as well as a comparison with similar homes in the area
Home Values in the Area
Average Home Value in this Area
Purchase History
| Date | Buyer | Sale Price | Title Company |
|---|---|---|---|
| Brehm Duane S | $350,000 | Transcounty Title Company | |
| M G Santos Inc | $210,000 | Fidelity Title Company |
Source: Public Records
Mortgage History
| Date | Status | Borrower | Loan Amount |
|---|---|---|---|
| Open | Brehm Duane S | $300,000 |
Source: Public Records
Tax History
| Year | Tax Paid | Tax Assessment Tax Assessment Total Assessment is a certain percentage of the fair market value that is determined by local assessors to be the total taxable value of land and additions on the property. | Land | Improvement |
|---|---|---|---|---|
| 2025 | $7,532 | $664,087 | $141,647 | $522,440 |
| 2024 | $7,532 | $669,417 | $138,870 | $530,547 |
| 2023 | $7,034 | $649,017 | $136,148 | $512,869 |
| 2022 | $6,933 | $636,091 | $133,479 | $502,612 |
| 2021 | $6,915 | $627,909 | $130,862 | $497,047 |
| 2020 | $6,689 | $607,498 | $129,521 | $477,977 |
| 2019 | $6,279 | $569,173 | $126,982 | $442,191 |
| 2018 | $6,169 | $564,552 | $124,493 | $440,059 |
| 2017 | $6,056 | $549,730 | $122,052 | $427,678 |
| 2016 | $6,254 | $550,233 | $119,659 | $430,574 |
| 2015 | $5,990 | $530,091 | $117,862 | $412,229 |
| 2014 | $5,969 | $532,445 | $115,554 | $416,891 |
Source: Public Records
Map
Nearby Homes
- 956 J St
- 1032 9th St
- 820 J St
- 1043 Adams Ave
- 1062 Madison Ave
- 631 I St
- 709 Madison Ave
- 1144 G St
- 422 J St
- 506 M St
- 1434 Hayley St
- 1014 3rd St
- 1501 Sarba Ct
- 1505 Sarba Ct
- 0 W Pacheco Blvd Unit MC25270249
- 1102 California Ave
- 2114 Coulter Ln Unit 393P
- 1775 Tomaso Ct
- 0 W I St Unit ML81999689
- 1437 Thomas St
Your Personal Tour Guide
Ask me questions while you tour the home.