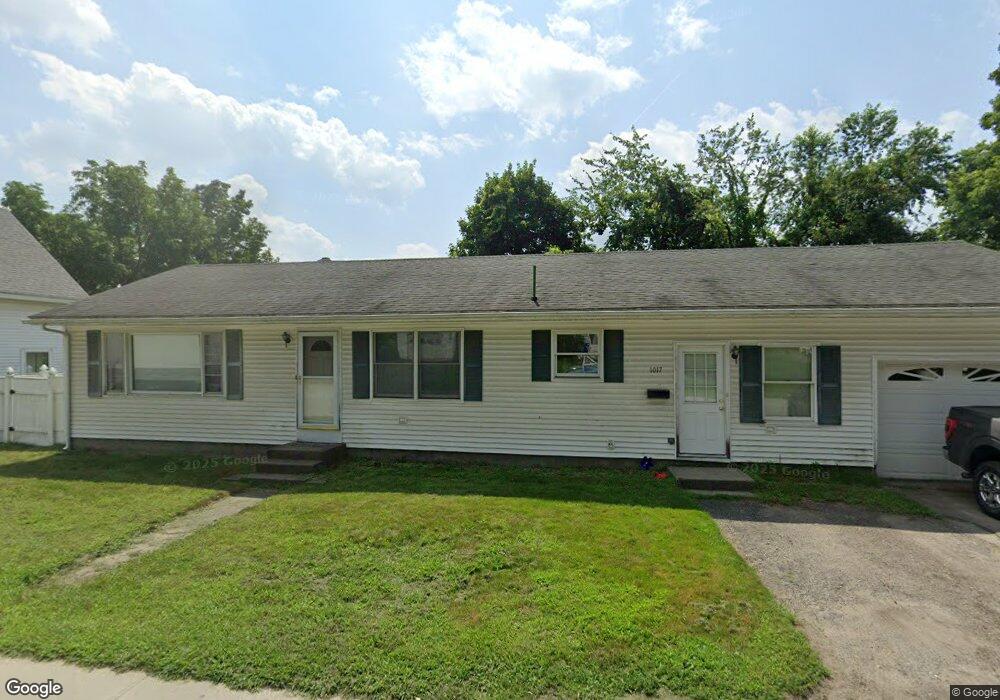
1017 Main St North Walpole, NH 03609
Estimated Value: $247,735 - $292,000
2
Beds
1
Bath
1,746
Sq Ft
$155/Sq Ft
Est. Value
About This Home
This home is located at 1017 Main St, North Walpole, NH 03609 and is currently estimated at $270,684, approximately $155 per square foot. 1017 Main St is a home located in Cheshire County with nearby schools including Walpole Primary School, North Walpole School, and Walpole Elementary School.
Ownership History
Date
Name
Owned For
Owner Type
Purchase Details
Closed on
Dec 12, 2003
Sold by
Cetto Angelo V Est
Bought by
Brough Mauris W and Brough Gwen E
Current Estimated Value
Home Financials for this Owner
Home Financials are based on the most recent Mortgage that was taken out on this home.
Original Mortgage
$74,000
Interest Rate
5.9%
Mortgage Type
Purchase Money Mortgage
Create a Home Valuation Report for This Property
The Home Valuation Report is an in-depth analysis detailing your home's value as well as a comparison with similar homes in the area
Home Values in the Area
Average Home Value in this Area
Purchase History
| Date | Buyer | Sale Price | Title Company |
|---|---|---|---|
| Brough Mauris W | $84,000 | -- |
Source: Public Records
Mortgage History
| Date | Status | Borrower | Loan Amount |
|---|---|---|---|
| Open | Brough Mauris W | $195,300 | |
| Closed | Brough Mauris W | $74,000 |
Source: Public Records
Tax History Compared to Growth
Tax History
| Year | Tax Paid | Tax Assessment Tax Assessment Total Assessment is a certain percentage of the fair market value that is determined by local assessors to be the total taxable value of land and additions on the property. | Land | Improvement |
|---|---|---|---|---|
| 2024 | $3,552 | $207,600 | $70,200 | $137,400 |
| 2023 | $3,371 | $207,600 | $70,200 | $137,400 |
| 2022 | $3,390 | $207,600 | $70,200 | $137,400 |
| 2021 | $2,393 | $94,100 | $34,600 | $59,500 |
| 2020 | $2,415 | $94,100 | $34,600 | $59,500 |
| 2019 | $2,400 | $94,100 | $34,600 | $59,500 |
| 2018 | $2,354 | $94,100 | $34,600 | $59,500 |
| 2017 | $2,274 | $94,100 | $34,600 | $59,500 |
| 2016 | $2,562 | $105,400 | $26,500 | $78,900 |
| 2015 | $2,436 | $105,400 | $26,500 | $78,900 |
| 2014 | $2,380 | $105,400 | $26,500 | $78,900 |
| 2013 | $2,323 | $105,400 | $26,500 | $78,900 |
Source: Public Records
Map
Nearby Homes
- 9 Center St
- 9 Merchant St
- 45 Church St
- 31 Mountain View Rd
- 20 Green Rd
- 34 Williams St
- 29 Green Rd
- 24 Rockingham St
- 12 Laurel Ave
- 13 Prospect St
- 24 South St
- 88 Westminster St
- 19 Williams Terrace
- 77 Griswold Dr
- 10 King St
- 36 Barker St
- 98 Darby Hill Rd
- 189 Shady Pines Park
- 204 Shady Pines
- 201 Shady Pines