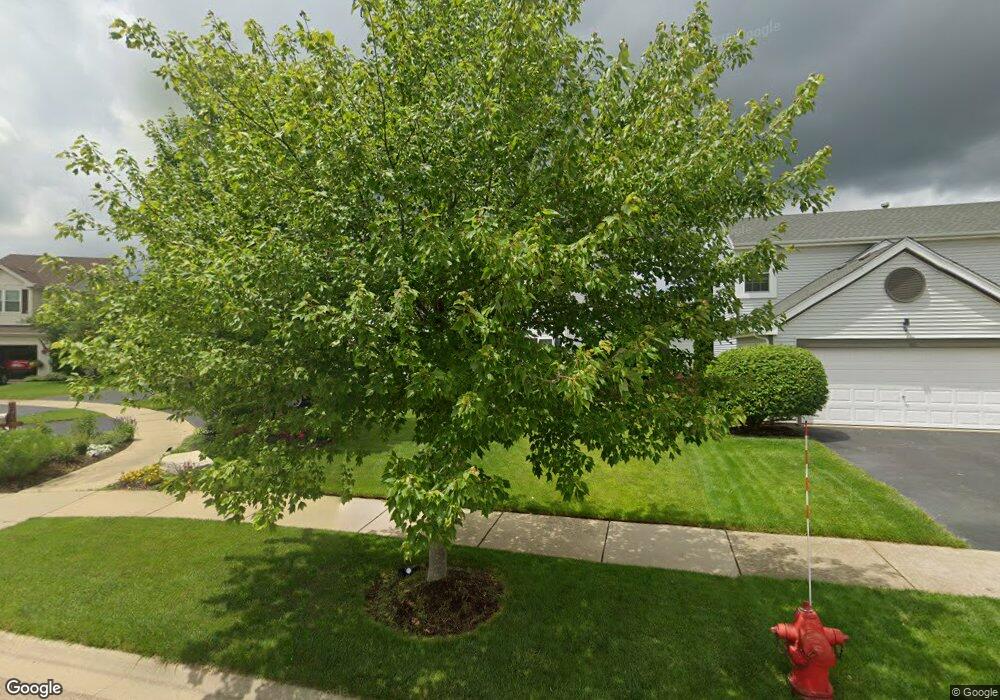
1017 Rosefield Ln Aurora, IL 60504
Far East NeighborhoodEstimated Value: $433,000 - $477,000
3
Beds
3
Baths
1,624
Sq Ft
$280/Sq Ft
Est. Value
About This Home
This home is located at 1017 Rosefield Ln, Aurora, IL 60504 and is currently estimated at $454,842, approximately $280 per square foot. 1017 Rosefield Ln is a home located in DuPage County with nearby schools including Owen Elementary School, Still Middle School, and Waubonsie Valley High School.
Ownership History
Date
Name
Owned For
Owner Type
Purchase Details
Closed on
Jun 12, 2007
Sold by
Lebeau Brett and Lebeau Brittney
Bought by
Witczak Ann Lebeau
Current Estimated Value
Home Financials for this Owner
Home Financials are based on the most recent Mortgage that was taken out on this home.
Original Mortgage
$238,000
Interest Rate
6.2%
Mortgage Type
Purchase Money Mortgage
Purchase Details
Closed on
Nov 10, 2000
Sold by
Crotty Michelle M and Lebeau Lawrence J
Bought by
Lebeau Brett and Lebeau Brittney
Purchase Details
Closed on
Sep 25, 1998
Sold by
The Ryland Group Inc
Bought by
Crotty Michelle M and Lebeau Lawrence J
Home Financials for this Owner
Home Financials are based on the most recent Mortgage that was taken out on this home.
Original Mortgage
$153,375
Interest Rate
6.72%
Mortgage Type
FHA
Create a Home Valuation Report for This Property
The Home Valuation Report is an in-depth analysis detailing your home's value as well as a comparison with similar homes in the area
Home Values in the Area
Average Home Value in this Area
Purchase History
| Date | Buyer | Sale Price | Title Company |
|---|---|---|---|
| Witczak Ann Lebeau | $283,000 | Pntn | |
| Lebeau Brett | $49,500 | Collar Counties Title Plant | |
| Crotty Michelle M | $173,000 | -- |
Source: Public Records
Mortgage History
| Date | Status | Borrower | Loan Amount |
|---|---|---|---|
| Open | Witczak Ann Lebeau | $238,000 | |
| Previous Owner | Crotty Michelle M | $153,375 |
Source: Public Records
Tax History Compared to Growth
Tax History
| Year | Tax Paid | Tax Assessment Tax Assessment Total Assessment is a certain percentage of the fair market value that is determined by local assessors to be the total taxable value of land and additions on the property. | Land | Improvement |
|---|---|---|---|---|
| 2024 | $9,106 | $127,761 | $34,967 | $92,794 |
| 2023 | $8,680 | $114,800 | $31,420 | $83,380 |
| 2022 | $8,300 | $104,980 | $28,510 | $76,470 |
| 2021 | $8,079 | $101,230 | $27,490 | $73,740 |
| 2020 | $8,177 | $101,230 | $27,490 | $73,740 |
| 2019 | $7,887 | $96,280 | $26,150 | $70,130 |
| 2018 | $7,498 | $90,890 | $24,230 | $66,660 |
| 2017 | $7,371 | $87,810 | $23,410 | $64,400 |
| 2016 | $7,237 | $84,270 | $22,470 | $61,800 |
| 2015 | $7,159 | $80,010 | $21,330 | $58,680 |
| 2014 | $6,759 | $73,840 | $19,530 | $54,310 |
| 2013 | $6,691 | $74,360 | $19,670 | $54,690 |
Source: Public Records
Map
Nearby Homes
- 3730 Baybrook Dr Unit 26
- 898 Lakestone Ln
- 1218 Birchdale Ln Unit 26
- 4015 Tansy Rd
- 1348 Amaranth Dr
- 3437 Charlemaine Dr
- 4105 Winslow Ct
- 4139 Winslow Ct
- 4118 Calder Ln
- 4515 Chelsea Manor Cir
- 4511 Chelsea Manor Cir
- 4055 Blackstone Dr
- 4138 Irving Rd
- 458 Watercress Dr
- 4219 Chelsea Manor Cir
- 3901 White Eagle Dr W
- 3473 Ravinia Cir
- 855 Finley Dr
- 4328 Chelsea Manor Cir
- 3356 Ravinia Cir
- 1025 Rosefield Ln
- 1009 Rosefield Ln
- 1044 Shoreline Dr
- 1001 Rosefield Ln
- 1030 Shoreline Dr
- 1046 Shoreline Dr
- 1033 Rosefield Ln Unit 26
- 1022 Shoreline Dr
- 1041 Rosefield Ln
- 1054 Shoreline Dr
- 993 Rosefield Ln
- 1050 Rosefield Ln
- 1006 Rosefield Ln
- 1014 Shoreline Dr
- 1049 Rosefield Ln
- 1062 Shoreline Dr
- 998 Rosefield Ln
- 985 Rosefield Ln
- 1057 Rosefield Ln
- 990 Rosefield Ln