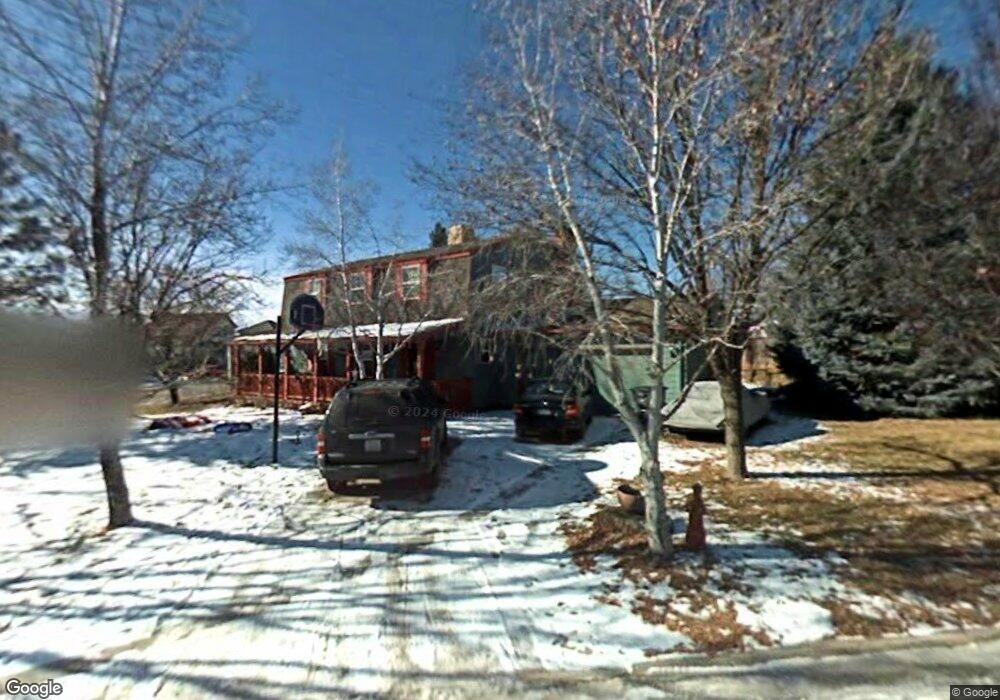
1017 S Cedar St Cortez, CO 81321
Estimated Value: $377,915 - $455,000
4
Beds
2
Baths
2,016
Sq Ft
$203/Sq Ft
Est. Value
About This Home
This home is located at 1017 S Cedar St, Cortez, CO 81321 and is currently estimated at $409,979, approximately $203 per square foot. 1017 S Cedar St is a home with nearby schools including Montezuma-Cortez High School, Children's Kiva Montessori School, and Children's Kiva Montessori Preschool & Kindergarten.
Ownership History
Date
Name
Owned For
Owner Type
Purchase Details
Closed on
Jul 26, 2023
Sold by
Carr Jeffrey G
Bought by
Carr Jeffrey G and Carr Millnda L
Current Estimated Value
Home Financials for this Owner
Home Financials are based on the most recent Mortgage that was taken out on this home.
Original Mortgage
$293,040
Outstanding Balance
$285,596
Interest Rate
6.67%
Mortgage Type
FHA
Estimated Equity
$124,383
Purchase Details
Closed on
Aug 2, 2007
Sold by
Crews David James and Crews Kelly Jean
Bought by
Carr Jeffrey G
Home Financials for this Owner
Home Financials are based on the most recent Mortgage that was taken out on this home.
Original Mortgage
$234,400
Interest Rate
6.73%
Mortgage Type
New Conventional
Purchase Details
Closed on
Dec 29, 1997
Sold by
Weston Christopher S
Bought by
Crews David James
Purchase Details
Closed on
Jun 15, 1990
Sold by
Phh Homequity
Bought by
Weston Christopher S
Purchase Details
Closed on
Sep 20, 1989
Sold by
Pittman Alfred L and Pittman Elle
Bought by
Phh Homequity
Create a Home Valuation Report for This Property
The Home Valuation Report is an in-depth analysis detailing your home's value as well as a comparison with similar homes in the area
Purchase History
| Date | Buyer | Sale Price | Title Company |
|---|---|---|---|
| Carr Jeffrey G | -- | Fin Title | |
| Carr Jeffrey G | $293,000 | Colorado Land Title Co | |
| Crews David James | $139,000 | -- | |
| Weston Christopher S | $91,200 | -- | |
| Phh Homequity | $102,500 | -- |
Source: Public Records
Mortgage History
| Date | Status | Borrower | Loan Amount |
|---|---|---|---|
| Open | Carr Jeffrey G | $293,040 | |
| Previous Owner | Carr Jeffrey G | $234,400 |
Source: Public Records
Tax History
| Year | Tax Paid | Tax Assessment Tax Assessment Total Assessment is a certain percentage of the fair market value that is determined by local assessors to be the total taxable value of land and additions on the property. | Land | Improvement |
|---|---|---|---|---|
| 2024 | $1,726 | $23,120 | $2,594 | $20,526 |
| 2023 | $1,188 | $27,499 | $3,086 | $24,413 |
| 2022 | $1,081 | $22,366 | $3,086 | $19,280 |
| 2021 | $1,100 | $22,366 | $3,086 | $19,280 |
| 2020 | $884 | $18,677 | $3,086 | $15,591 |
| 2019 | $886 | $18,677 | $3,086 | $15,591 |
| 2018 | $1,159 | $18,190 | $2,790 | $15,400 |
| 2017 | $1,154 | $18,190 | $2,790 | $15,400 |
| 2016 | $1,025 | $17,840 | $3,090 | $14,750 |
| 2015 | $941 | $259,750 | $0 | $0 |
| 2014 | $1,095 | $17,840 | $0 | $0 |
Source: Public Records
Map
Nearby Homes
- 1005 S Cedar St
- 617 Apple Dr
- 608 Alameda Dr
- 706 Apple Dr
- 511 Juniper Place
- 530 Juniper Place
- 526 Juniper Place
- 8663 Road 25
- 706 S Cedar St
- TBD U S 491
- 520 W 6th St Unit 15
- 915 S Broadway
- 821 S Chestnut St
- 770 Stratton Dr
- 29 W Andrew Ln
- 16 W 10th St
- 8 W 10th St
- 818 Stratton Dr
- 420 W 4th St
- 313 S Broadway
- 1013 S Cedar St
- 604 Detroit Ave
- 0 Cedar St Unit 759170
- 0 Cedar St Unit 632419
- 0 Cedar St Unit 654684
- 0 Cedar St Unit 701589
- 0 Cedar St Unit 717079
- 607 Colfax Ave
- 1201 S Cedar St
- 1010 S Cedar St
- 601 Detroit Ave
- 1014 S Cedar St
- 0 Detroit Ave
- 603 Detroit Ave
- 1006 S Cedar St
- 606 Detroit Ave
- 1009 S Cedar St
- 1009 S Cedar St
- 600 Apple Dr
- 602 Apple Dr
Your Personal Tour Guide
Ask me questions while you tour the home.