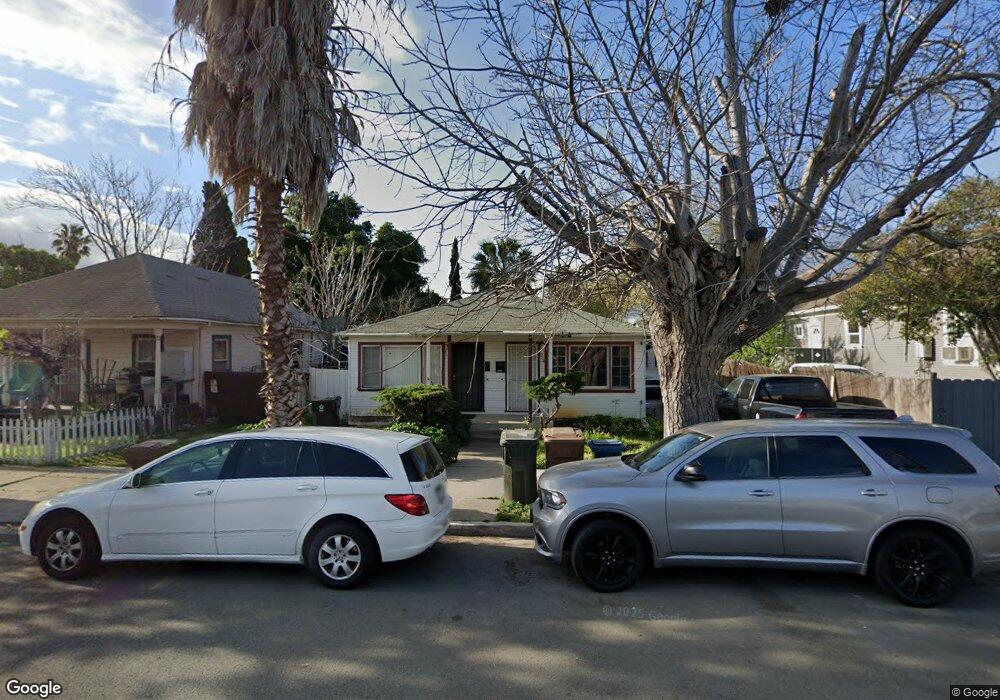
1017 W 5th St Unit 1019 Antioch, CA 94509
North Antioch NeighborhoodEstimated Value: $322,000 - $510,000
2
Beds
2
Baths
1,320
Sq Ft
$339/Sq Ft
Est. Value
About This Home
This home is located at 1017 W 5th St Unit 1019, Antioch, CA 94509 and is currently estimated at $448,135, approximately $339 per square foot. 1017 W 5th St Unit 1019 is a home located in Contra Costa County with nearby schools including Fremont Elementary School, Antioch Middle School, and Antioch High School.
Ownership History
Date
Name
Owned For
Owner Type
Purchase Details
Closed on
Mar 11, 2014
Sold by
Rivera Miguel A
Bought by
Rivera Miguel A and Aguasvivas Rivera Maria B
Current Estimated Value
Purchase Details
Closed on
Aug 14, 2009
Sold by
Rivera Miguel and Rivera Maria
Bought by
Rivera Miguel A
Home Financials for this Owner
Home Financials are based on the most recent Mortgage that was taken out on this home.
Original Mortgage
$55,000
Interest Rate
5.17%
Mortgage Type
Stand Alone Refi Refinance Of Original Loan
Purchase Details
Closed on
Jun 10, 2004
Sold by
Rivera Miguel and Rivera Maria
Bought by
Rivera Miguel A
Create a Home Valuation Report for This Property
The Home Valuation Report is an in-depth analysis detailing your home's value as well as a comparison with similar homes in the area
Home Values in the Area
Average Home Value in this Area
Purchase History
| Date | Buyer | Sale Price | Title Company |
|---|---|---|---|
| Rivera Miguel A | -- | None Available | |
| Rivera Miguel A | -- | North American Title Company | |
| Rivera Miguel A | -- | -- |
Source: Public Records
Mortgage History
| Date | Status | Borrower | Loan Amount |
|---|---|---|---|
| Closed | Rivera Miguel A | $55,000 |
Source: Public Records
Tax History Compared to Growth
Tax History
| Year | Tax Paid | Tax Assessment Tax Assessment Total Assessment is a certain percentage of the fair market value that is determined by local assessors to be the total taxable value of land and additions on the property. | Land | Improvement |
|---|---|---|---|---|
| 2025 | $2,313 | $116,187 | $52,811 | $63,376 |
| 2024 | $2,233 | $113,910 | $51,776 | $62,134 |
| 2023 | $2,233 | $111,677 | $50,761 | $60,916 |
| 2022 | $2,212 | $109,488 | $49,766 | $59,722 |
| 2021 | $2,125 | $107,342 | $48,791 | $58,551 |
| 2019 | $2,042 | $104,160 | $47,345 | $56,815 |
| 2018 | $1,968 | $102,118 | $46,417 | $55,701 |
| 2017 | $1,901 | $100,116 | $45,507 | $54,609 |
| 2016 | $1,830 | $98,154 | $44,615 | $53,539 |
| 2015 | $1,786 | $96,680 | $43,945 | $52,735 |
| 2014 | $1,719 | $94,787 | $43,085 | $51,702 |
Source: Public Records
Map
Nearby Homes