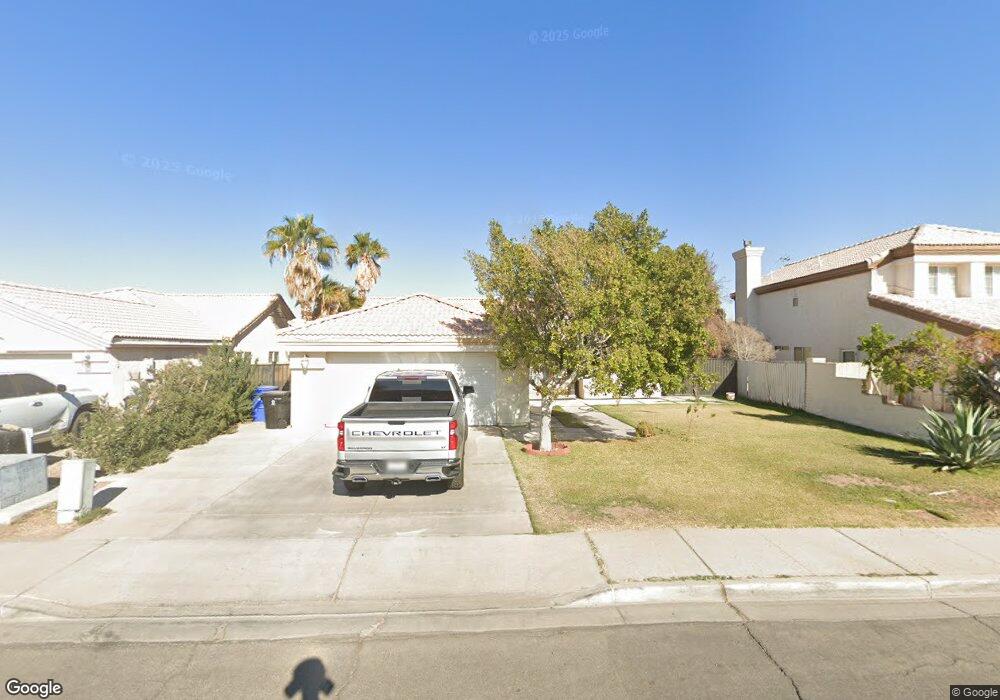
1017 Zapata St Calexico, CA 92231
Estimated Value: $404,000 - $454,000
3
Beds
2
Baths
1,531
Sq Ft
$273/Sq Ft
Est. Value
About This Home
This home is located at 1017 Zapata St, Calexico, CA 92231 and is currently estimated at $418,552, approximately $273 per square foot. 1017 Zapata St is a home located in Imperial County with nearby schools including Kennedy Gardens Elementary School, William Moreno Junior High School, and Calexico High School.
Ownership History
Date
Name
Owned For
Owner Type
Purchase Details
Closed on
Sep 15, 2025
Sold by
Garcia Jose G and Garcia Maria J
Bought by
Jose Guadalupe Garcia Gomez and Jose Maria De
Current Estimated Value
Purchase Details
Closed on
Jul 31, 2008
Sold by
The Bank Of New York Trust Co Na
Bought by
Garcia Jose G and Garcia Maria J
Home Financials for this Owner
Home Financials are based on the most recent Mortgage that was taken out on this home.
Original Mortgage
$128,000
Interest Rate
6.37%
Mortgage Type
Purchase Money Mortgage
Purchase Details
Closed on
May 10, 2008
Sold by
Felix Jose M
Bought by
The Bank Of New York Trust Co Na and Jpmorgan Chase Bank Na
Purchase Details
Closed on
Sep 21, 2006
Sold by
Gonzalez Marie
Bought by
Gonzalez Marie and Roman Guadalupe
Purchase Details
Closed on
Mar 4, 2004
Sold by
Velasco Liberto and Velasco Celia F
Bought by
Felix Jose M
Home Financials for this Owner
Home Financials are based on the most recent Mortgage that was taken out on this home.
Original Mortgage
$144,000
Interest Rate
5.75%
Mortgage Type
Purchase Money Mortgage
Create a Home Valuation Report for This Property
The Home Valuation Report is an in-depth analysis detailing your home's value as well as a comparison with similar homes in the area
Purchase History
| Date | Buyer | Sale Price | Title Company |
|---|---|---|---|
| Jose Guadalupe Garcia Gomez | -- | None Listed On Document | |
| Garcia Jose G | $168,000 | Lsi Title Company Ca | |
| The Bank Of New York Trust Co Na | $200,000 | None Available | |
| Gonzalez Marie | -- | None Available | |
| Felix Jose M | $180,000 | Commonwealth Land Title Co |
Source: Public Records
Mortgage History
| Date | Status | Borrower | Loan Amount |
|---|---|---|---|
| Previous Owner | Garcia Jose G | $128,000 | |
| Previous Owner | Felix Jose M | $144,000 | |
| Closed | Felix Jose M | $36,000 |
Source: Public Records
Tax History
| Year | Tax Paid | Tax Assessment Tax Assessment Total Assessment is a certain percentage of the fair market value that is determined by local assessors to be the total taxable value of land and additions on the property. | Land | Improvement |
|---|---|---|---|---|
| 2025 | $2,629 | $216,328 | $90,135 | $126,193 |
| 2023 | $2,629 | $207,930 | $86,636 | $121,294 |
| 2022 | $2,546 | $203,854 | $84,938 | $118,916 |
| 2021 | $2,471 | $199,858 | $83,273 | $116,585 |
| 2020 | $2,379 | $197,810 | $82,420 | $115,390 |
| 2019 | $2,311 | $193,932 | $80,804 | $113,128 |
| 2018 | $2,290 | $190,130 | $79,220 | $110,910 |
| 2017 | $2,124 | $186,403 | $77,667 | $108,736 |
| 2016 | $2,026 | $182,749 | $76,145 | $106,604 |
| 2015 | $1,991 | $180,005 | $75,002 | $105,003 |
| 2014 | $1,671 | $151,569 | $35,000 | $116,569 |
Source: Public Records
Map
Nearby Homes
- 2117 Descanso Dr
- 1900 Rancho Frontera Ave Unit H59
- 1268 Topaz Ct
- 248 Hernandez St
- 1000 E Cole Rd
- 0 E Cole Rd Unit Lot 1 250029524
- 1301 W Calle de Oro
- 1245 C N Perry Rd
- 1160 Rosas St Unit 152
- 0 Avenida de Oro
- 105 John Kennedy St
- 711 N Preston Dr
- 1070 Heber Ave
- 1061 Heber Ave
- 38 Las Flores Dr
- 1119 Imperial Ave W
- 700 Blair Ave
- 817 E 6th St
- 201 E Sherman St
- 21 E 7th St
- 1017 Zapata St
- 1015 Zapata St
- 1019 Zapata St
- 1018 Santa Ana St
- 1016 Santa Ana St
- 1020 Santa Ana St
- 1013 Zapata St
- 1014 Santa Ana St
- 1022 Zapata St
- 1024 Zapata St
- 1020 Zapata St
- 1012 Santa Ana St
- 1011 Zapata St
- 2100 Coyote Ave
- 1018 Zapata St
- 2104 Coyote Ave
- 1010 Santa Ana St
- 2116 Descanso Dr
- 1021 Alameda St
- 1998 Coyote Ave