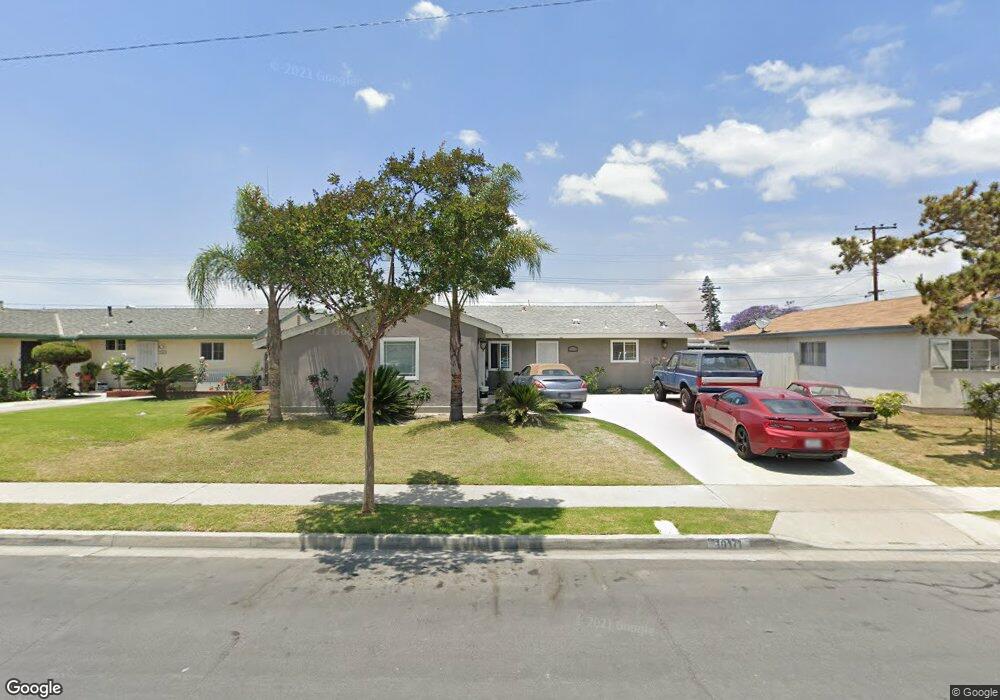
10171 Christopher St Cypress, CA 90630
Estimated Value: $914,840 - $1,073,000
4
Beds
3
Baths
1,205
Sq Ft
$831/Sq Ft
Est. Value
About This Home
This home is located at 10171 Christopher St, Cypress, CA 90630 and is currently estimated at $1,000,960, approximately $830 per square foot. 10171 Christopher St is a home located in Orange County with nearby schools including Margaret Landell Elementary School, A.E. Arnold Elementary School, and Lexington Junior High School.
Ownership History
Date
Name
Owned For
Owner Type
Purchase Details
Closed on
May 2, 2017
Sold by
Manukian Mary
Bought by
K & H Trust
Current Estimated Value
Purchase Details
Closed on
Aug 23, 2007
Sold by
Manukian Edward
Bought by
Manukian Mary
Purchase Details
Closed on
Jul 14, 2004
Sold by
Manukian Mary
Bought by
Manukian Edward
Home Financials for this Owner
Home Financials are based on the most recent Mortgage that was taken out on this home.
Original Mortgage
$387,000
Outstanding Balance
$182,877
Interest Rate
5.4%
Mortgage Type
New Conventional
Estimated Equity
$818,083
Purchase Details
Closed on
Jan 2, 2004
Sold by
Manukian Edward and Manukian Mary
Bought by
Manukian Edward and Manukian Mary
Home Financials for this Owner
Home Financials are based on the most recent Mortgage that was taken out on this home.
Original Mortgage
$140,000
Interest Rate
6.02%
Mortgage Type
Credit Line Revolving
Purchase Details
Closed on
Dec 19, 1995
Sold by
Jackson Martin C and Jackson Jennifer
Bought by
Manoukian Eduard and Manoukian Mary
Home Financials for this Owner
Home Financials are based on the most recent Mortgage that was taken out on this home.
Original Mortgage
$144,479
Interest Rate
7.14%
Mortgage Type
FHA
Create a Home Valuation Report for This Property
The Home Valuation Report is an in-depth analysis detailing your home's value as well as a comparison with similar homes in the area
Home Values in the Area
Average Home Value in this Area
Purchase History
| Date | Buyer | Sale Price | Title Company |
|---|---|---|---|
| K & H Trust | -- | None Available | |
| Manukian Mary | -- | None Available | |
| Manukian Edward | -- | First American Title Co | |
| Manukian Edward | -- | Ticor Title Company | |
| Manoukian Eduard | $157,000 | Fidelity National Title Ins |
Source: Public Records
Mortgage History
| Date | Status | Borrower | Loan Amount |
|---|---|---|---|
| Open | Manukian Edward | $387,000 | |
| Closed | Manukian Edward | $140,000 | |
| Previous Owner | Manoukian Eduard | $144,479 |
Source: Public Records
Tax History
| Year | Tax Paid | Tax Assessment Tax Assessment Total Assessment is a certain percentage of the fair market value that is determined by local assessors to be the total taxable value of land and additions on the property. | Land | Improvement |
|---|---|---|---|---|
| 2025 | $3,647 | $305,821 | $182,385 | $123,436 |
| 2024 | $3,647 | $299,825 | $178,809 | $121,016 |
| 2023 | $3,562 | $293,947 | $175,303 | $118,644 |
| 2022 | $3,518 | $288,184 | $171,866 | $116,318 |
| 2021 | $3,473 | $282,534 | $168,496 | $114,038 |
| 2020 | $3,458 | $279,637 | $166,768 | $112,869 |
| 2019 | $3,366 | $274,154 | $163,498 | $110,656 |
| 2018 | $3,321 | $268,779 | $160,292 | $108,487 |
| 2017 | $3,211 | $263,509 | $157,149 | $106,360 |
| 2016 | $3,184 | $258,343 | $154,068 | $104,275 |
| 2015 | $3,160 | $254,463 | $151,754 | $102,709 |
| 2014 | $2,997 | $249,479 | $148,781 | $100,698 |
Source: Public Records
Map
Nearby Homes
- 10292 Ethel St
- 10151 Christopher St
- 4811 Myra Ave
- 4691 Cathy Ave
- 10321 Janice Lynn St
- 4611 Myra Ave
- 5101 Myra Ave
- 4586 Larwin Ave
- 9916 Fonte Rd
- 4385 Larwin Ave
- 4449 Avenida Granada
- 10191 Noel St
- 10411 Saint Alban St
- 9608 Seville Way
- 4236 Larwin Ave
- 5353 Cumberland Dr
- 9598 Naples Dr
- 10943 Carrillo Ct
- 9826 Saint George Cir
- 10947 Carrillo Ct
- 10161 Christopher St
- 10191 Christopher St
- 10172 Gregory St
- 10162 Gregory St
- 10192 Gregory St
- 10201 Christopher St
- 10172 Christopher St
- 10152 Gregory St
- 10202 Gregory St
- 10162 Christopher St
- 4881 William Ave
- 10211 Christopher St
- 10152 Christopher St
- 10212 Gregory St
- 4901 William Ave
- 10161 Esther Cir
- 10221 Christopher St
- 10171 Gregory St
- 10161 Gregory St
- 10191 Gregory St
Your Personal Tour Guide
Ask me questions while you tour the home.