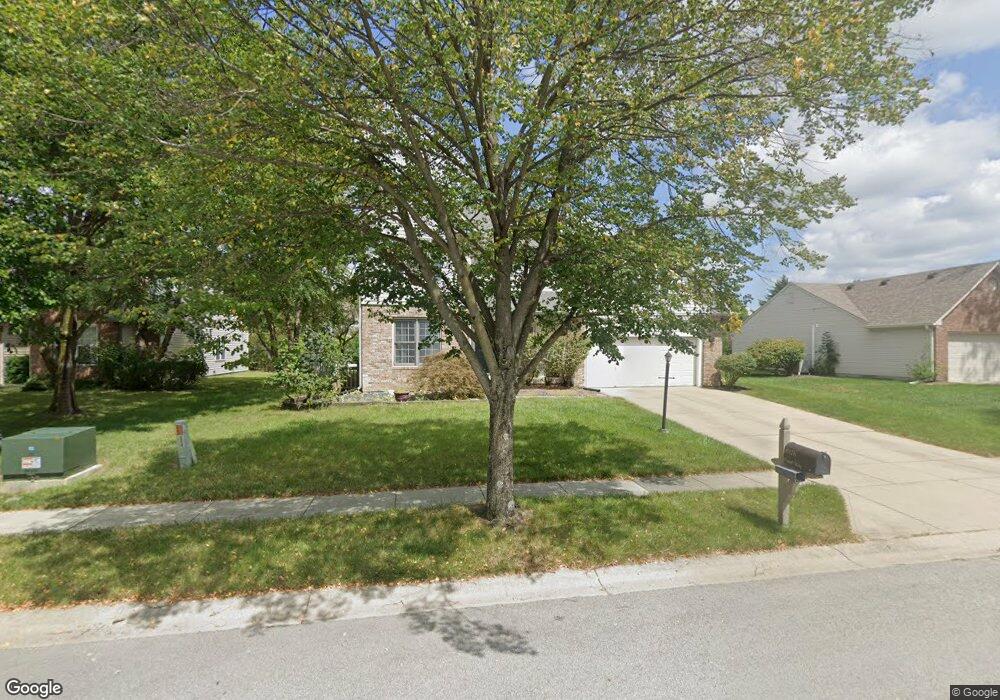
10176 Canal Way Noblesville, IN 46060
Estimated Value: $314,000 - $389,624
4
Beds
3
Baths
3,120
Sq Ft
$116/Sq Ft
Est. Value
About This Home
This home is located at 10176 Canal Way, Noblesville, IN 46060 and is currently estimated at $362,406, approximately $116 per square foot. 10176 Canal Way is a home located in Hamilton County with nearby schools including White River Elementary School, Noblesville East Middle School, and Noblesville High School.
Ownership History
Date
Name
Owned For
Owner Type
Purchase Details
Closed on
Sep 19, 2012
Sold by
Morehead Ashley
Bought by
Seymour Paul M
Current Estimated Value
Purchase Details
Closed on
Aug 21, 2012
Sold by
Morehead Ashley
Bought by
Seymour Paul M
Purchase Details
Closed on
Mar 19, 2012
Sold by
Morehend Ashley
Bought by
Seymour Paul M
Purchase Details
Closed on
Oct 12, 2009
Sold by
Federal Home Loan Mortgage Corporation
Bought by
Seymour Paul M and Morehead Ashley
Home Financials for this Owner
Home Financials are based on the most recent Mortgage that was taken out on this home.
Original Mortgage
$104,039
Interest Rate
4.9%
Mortgage Type
FHA
Purchase Details
Closed on
Sep 3, 2009
Sold by
Clemence Dominic and Clemence Anne M
Bought by
Federal Home Loan Mortgage Corp
Home Financials for this Owner
Home Financials are based on the most recent Mortgage that was taken out on this home.
Original Mortgage
$104,039
Interest Rate
4.9%
Mortgage Type
FHA
Create a Home Valuation Report for This Property
The Home Valuation Report is an in-depth analysis detailing your home's value as well as a comparison with similar homes in the area
Home Values in the Area
Average Home Value in this Area
Purchase History
| Date | Buyer | Sale Price | Title Company |
|---|---|---|---|
| Seymour Paul M | -- | None Available | |
| Seymour Paul M | -- | None Available | |
| Seymour Paul M | -- | None Available | |
| Seymour Paul M | -- | Statewide Title Company Inc | |
| Federal Home Loan Mortgage Corp | $173,540 | None Available |
Source: Public Records
Mortgage History
| Date | Status | Borrower | Loan Amount |
|---|---|---|---|
| Previous Owner | Seymour Paul M | $104,039 |
Source: Public Records
Tax History Compared to Growth
Tax History
| Year | Tax Paid | Tax Assessment Tax Assessment Total Assessment is a certain percentage of the fair market value that is determined by local assessors to be the total taxable value of land and additions on the property. | Land | Improvement |
|---|---|---|---|---|
| 2024 | $4,106 | $329,000 | $58,900 | $270,100 |
| 2023 | $4,106 | $329,100 | $58,900 | $270,200 |
| 2022 | $3,509 | $271,800 | $58,900 | $212,900 |
| 2021 | $2,493 | $198,100 | $58,900 | $139,200 |
| 2020 | $2,355 | $183,000 | $58,900 | $124,100 |
| 2019 | $2,141 | $174,500 | $22,700 | $151,800 |
| 2018 | $1,966 | $157,800 | $22,700 | $135,100 |
| 2017 | $1,696 | $142,600 | $22,700 | $119,900 |
| 2016 | $1,634 | $139,000 | $22,700 | $116,300 |
| 2014 | $1,570 | $134,400 | $23,000 | $111,400 |
| 2013 | $1,570 | $133,500 | $23,000 | $110,500 |
Source: Public Records
Map
Nearby Homes
- 19237 Lupine Ct
- 19228 Amber Way
- 10214 Carmine Dr
- 10113 E 191st St
- 9993 Pepper Tree Ln
- 19408 Amber Way
- 19557 Salt Creek Ct
- 10511 Hyacinth Ct
- 10604 Magenta Dr
- 19485 Amber Way
- 19250 Green Valley Dr
- 18906 Fairfield Blvd
- 19145 Roudebush Blvd
- 10819 Upland Way
- 19212 Golden Meadow Way
- 19367 Roudebush Blvd
- 19352 Potters Bridge Rd
- 18875 Wimbley Way
- 9853 Traditions Ln
- 19311 Morrison Way
- 10160 Canal Way
- 10192 Canal Way
- 19229 Lupine Ct
- 10208 Canal Way
- 19225 Amber Way
- 10142 Canal Way
- 19223 Amber Way
- 19227 Amber Way
- 19231 Lupine Ct
- 10224 Canal Way
- 10197 Canal Way
- 19221 Amber Way
- 10134 Canal Way
- 10213 Canal Way
- 19233 Lupine Ct
- 19217 Amber Way
- 19226 Amber Way
- 19224 Amber Way
- 19235 Lupine Ct