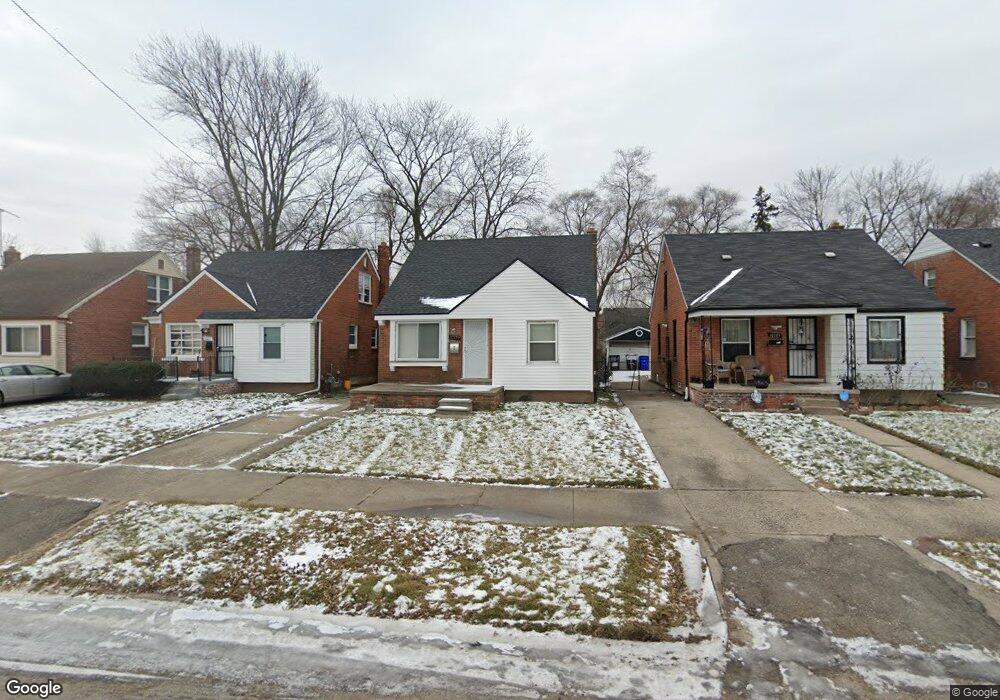
10177 Boleyn St Detroit, MI 48224
Yorkshire Woods NeighborhoodEstimated Value: $47,000 - $51,705
3
Beds
1
Bath
767
Sq Ft
$64/Sq Ft
Est. Value
About This Home
This home is located at 10177 Boleyn St, Detroit, MI 48224 and is currently estimated at $48,926, approximately $63 per square foot. 10177 Boleyn St is a home located in Wayne County with nearby schools including Carleton Elementary School, Edward 'Duke' Ellington Conservatory of Music and Art, and Charles L. Spain Elementary-Middle School.
Ownership History
Date
Name
Owned For
Owner Type
Purchase Details
Closed on
May 2, 2025
Sold by
Next Era Rentals Llc
Bought by
1413570 Ontario Inc
Current Estimated Value
Purchase Details
Closed on
Dec 23, 2019
Sold by
Weber Nicholas
Bought by
Next Era Rentals Llc
Purchase Details
Closed on
Aug 23, 2018
Sold by
Detroit Land Bank Authority
Bought by
Weber Nicholas
Purchase Details
Closed on
Jan 13, 2016
Sold by
Wayne County Treasurer
Bought by
Detroit Land Bank Authority
Purchase Details
Closed on
Jan 23, 2015
Sold by
Empowerment Passmore Valencia
Bought by
Guyton Tyree and Virgin Toyouna
Purchase Details
Closed on
Dec 21, 2012
Sold by
Swe Homes Mi Llc
Bought by
Main Street Empowerment & Housing Organi
Purchase Details
Closed on
Apr 12, 2010
Sold by
Nationstar Mortgage Llc
Bought by
Federal National Mortgage Association
Purchase Details
Closed on
Apr 7, 2010
Sold by
Lawson Victoria J
Bought by
Nationstar Mortgage Llc
Create a Home Valuation Report for This Property
The Home Valuation Report is an in-depth analysis detailing your home's value as well as a comparison with similar homes in the area
Home Values in the Area
Average Home Value in this Area
Purchase History
| Date | Buyer | Sale Price | Title Company |
|---|---|---|---|
| 1413570 Ontario Inc | $50,000 | None Listed On Document | |
| Next Era Rentals Llc | -- | None Available | |
| Weber Nicholas | $2,000 | None Available | |
| Detroit Land Bank Authority | -- | None Available | |
| Guyton Tyree | $1,600 | None Available | |
| Main Street Empowerment & Housing Organi | -- | None Available | |
| Federal National Mortgage Association | -- | None Available | |
| Nationstar Mortgage Llc | $59,238 | None Available |
Source: Public Records
Tax History Compared to Growth
Tax History
| Year | Tax Paid | Tax Assessment Tax Assessment Total Assessment is a certain percentage of the fair market value that is determined by local assessors to be the total taxable value of land and additions on the property. | Land | Improvement |
|---|---|---|---|---|
| 2025 | $1,048 | $27,800 | $0 | $0 |
| 2024 | $1,048 | $23,600 | $0 | $0 |
| 2023 | $1,016 | $19,200 | $0 | $0 |
| 2022 | $1,080 | $16,800 | $0 | $0 |
| 2021 | $1,052 | $11,700 | $0 | $0 |
| 2020 | $1,052 | $10,400 | $0 | $0 |
| 2019 | $1,036 | $9,000 | $0 | $0 |
| 2018 | $0 | $0 | $0 | $0 |
| 2017 | $1,300 | $0 | $0 | $0 |
| 2016 | $240 | $13,000 | $0 | $0 |
| 2015 | $1,300 | $13,000 | $0 | $0 |
| 2013 | $1,805 | $18,053 | $0 | $0 |
| 2010 | -- | $26,467 | $920 | $25,547 |
Source: Public Records
Map
Nearby Homes
- 10311 Britain St
- 9969 Bishop St
- 9257 Bishop St
- 10642 Mckinney St
- 10319 Mckinney St
- 10253 Mckinney St
- 10716 Mckinney St
- 10088 Britain St
- 9160 Boleyn St
- 10446 Balfour Rd
- 10738 Mckinney St
- 10800 Somerset Ave
- 10830 Mckinney St
- 10827 Balfour Rd
- 9801 Kensington Ave
- 10731 Somerset Ave
- 10878 Balfour Rd
- 10595 Somerset Ave
- 10842 Nottingham Rd
- 10818 Nottingham Rd
- 10165 Boleyn St
- 10185 Boleyn St
- 10171 Boleyn St
- 10191 Boleyn St
- 10143 Boleyn St
- 10157 Boleyn St
- 10201 Boleyn St
- 10084 Grayton St
- 10076 Grayton St
- 10090 Grayton St
- 10151 Boleyn St
- 10070 Grayton St
- 10100 Grayton St
- 10062 Grayton St
- 10106 Grayton St
- 10056 Grayton St
- 10048 Grayton St
- 10135 Boleyn St
- 10436 Mckinney St
- 10440 Mckinney St