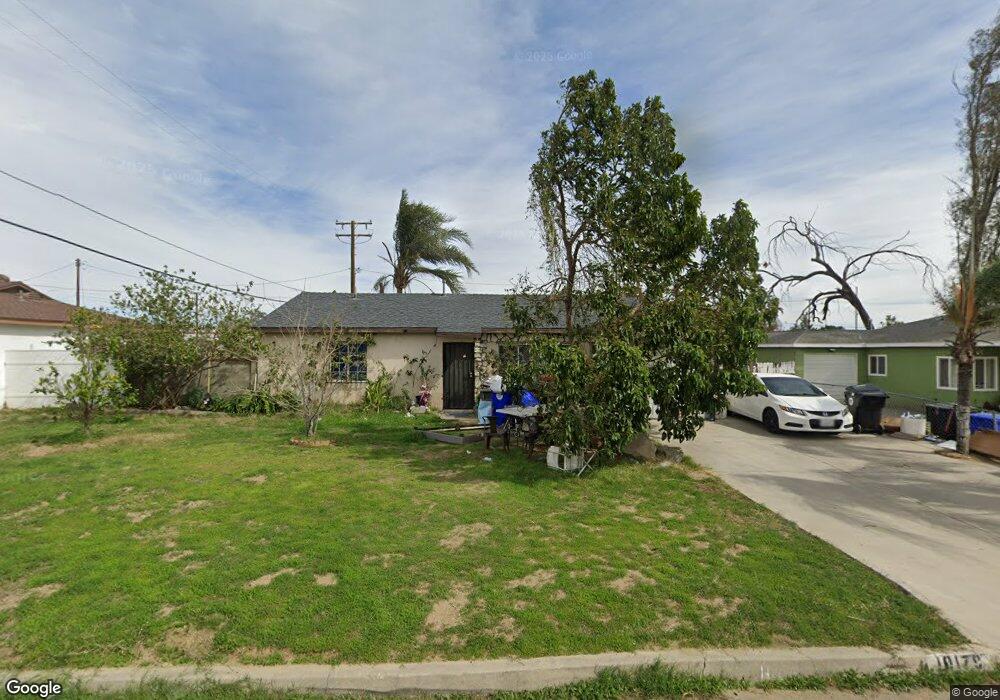
10179 Toyon Ave Fontana, CA 92335
Estimated Value: $502,000 - $556,000
3
Beds
1
Bath
1,147
Sq Ft
$452/Sq Ft
Est. Value
About This Home
This home is located at 10179 Toyon Ave, Fontana, CA 92335 and is currently estimated at $518,082, approximately $451 per square foot. 10179 Toyon Ave is a home located in San Bernardino County with nearby schools including Cypress Elementary School, Harry S. Truman Middle School, and Jurupa Hills High School.
Ownership History
Date
Name
Owned For
Owner Type
Purchase Details
Closed on
Sep 16, 1998
Sold by
Federal National Mortgage Association
Bought by
Moreno Hugo and Moreno Silvia
Current Estimated Value
Home Financials for this Owner
Home Financials are based on the most recent Mortgage that was taken out on this home.
Original Mortgage
$73,222
Outstanding Balance
$15,614
Interest Rate
6.88%
Mortgage Type
FHA
Estimated Equity
$502,468
Purchase Details
Closed on
Jul 30, 1998
Sold by
Lopin Paul M and Lopin Sherry L
Bought by
Federal National Mortgage Association
Home Financials for this Owner
Home Financials are based on the most recent Mortgage that was taken out on this home.
Original Mortgage
$73,222
Outstanding Balance
$15,614
Interest Rate
6.88%
Mortgage Type
FHA
Estimated Equity
$502,468
Create a Home Valuation Report for This Property
The Home Valuation Report is an in-depth analysis detailing your home's value as well as a comparison with similar homes in the area
Purchase History
| Date | Buyer | Sale Price | Title Company |
|---|---|---|---|
| Moreno Hugo | $73,000 | Commonwealth Land Title Co | |
| Federal National Mortgage Association | $75,000 | First Southwestern Title Co |
Source: Public Records
Mortgage History
| Date | Status | Borrower | Loan Amount |
|---|---|---|---|
| Open | Moreno Hugo | $73,222 |
Source: Public Records
Tax History
| Year | Tax Paid | Tax Assessment Tax Assessment Total Assessment is a certain percentage of the fair market value that is determined by local assessors to be the total taxable value of land and additions on the property. | Land | Improvement |
|---|---|---|---|---|
| 2025 | $1,756 | $122,963 | $28,529 | $94,434 |
| 2024 | $1,646 | $120,552 | $27,970 | $92,582 |
| 2023 | $1,614 | $118,189 | $27,422 | $90,767 |
| 2022 | $1,584 | $115,871 | $26,884 | $88,987 |
| 2021 | $1,550 | $113,599 | $26,357 | $87,242 |
| 2020 | $1,529 | $112,434 | $26,087 | $86,347 |
| 2019 | $1,472 | $110,229 | $25,575 | $84,654 |
| 2018 | $1,465 | $108,068 | $25,074 | $82,994 |
| 2017 | $1,441 | $105,949 | $24,582 | $81,367 |
| 2016 | $1,421 | $103,872 | $24,100 | $79,772 |
| 2015 | $1,384 | $102,312 | $23,738 | $78,574 |
| 2014 | $1,383 | $100,308 | $23,273 | $77,035 |
Source: Public Records
Map
Nearby Homes
- 16510 Iris Dr
- 9955 Briarwood Ave
- 9906 Cypress Ave
- 9850 Cypress Ave
- 16569 Slover Ave
- 9825 Chantry Ave
- 10512 Juniper Ave
- 16860 Slover Ave Unit 54
- 16860 Slover Ave Unit 67
- 9758 Juniper Ave
- 9721 Juniper Ave
- 16636 Parsley Ln
- 16803 San Bernardino Ave
- 9614 Cypress Ave
- 16108 Tullock St
- 16341 Holly Dr
- 10881 Oleander Ave
- 15798 Slover Ave
- 17255 Valley Blvd Sp 12w
- 17333 Valley Blvd Unit 79
- 10189 Toyon Ave
- 10169 Toyon Ave
- 10180 Cypress Ave
- 10159 Toyon Ave
- 16460 Balsam Ave
- 16465 Balsam Ave
- 16461 Taylor Ave
- 16448 Balsam Ave
- 16449 Taylor Ave
- 16449 Balsam Ave
- 16440 Balsam Ave
- 16488 Taylor Ave
- 16482 Taylor Ave
- 16441 Taylor Ave
- 16441 Balsam Ave
- 16430 Balsam Ave
- 16462 Taylor Ave
- 16470 Washington Dr
- 16462 Washington Dr
- 16454 Washington Dr
Your Personal Tour Guide
Ask me questions while you tour the home.