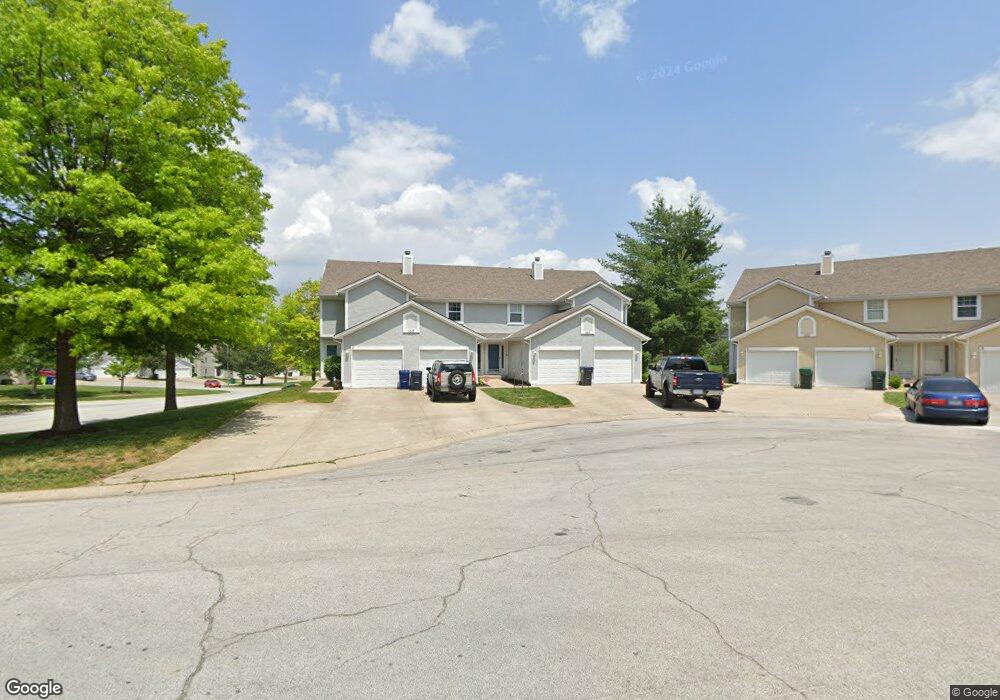
1017B NE Whispering Winds Cir Lees Summit, MO 64064
Estimated Value: $208,000 - $308,000
2
Beds
3
Baths
1,262
Sq Ft
$197/Sq Ft
Est. Value
About This Home
This home is located at 1017B NE Whispering Winds Cir, Lees Summit, MO 64064 and is currently estimated at $248,488, approximately $196 per square foot. 1017B NE Whispering Winds Cir is a home located in Jackson County with nearby schools including Voy Spears Jr. Elementary School, Delta Woods Middle School, and Blue Springs South High School.
Ownership History
Date
Name
Owned For
Owner Type
Purchase Details
Closed on
Jun 23, 2022
Sold by
Ha Helena and Nguyen Michael R
Bought by
Davis Jeremy B
Current Estimated Value
Home Financials for this Owner
Home Financials are based on the most recent Mortgage that was taken out on this home.
Original Mortgage
$207,100
Outstanding Balance
$197,108
Interest Rate
5.3%
Mortgage Type
New Conventional
Estimated Equity
$51,380
Purchase Details
Closed on
Oct 28, 2021
Sold by
Turner Kathleen
Bought by
Ha Helena
Home Financials for this Owner
Home Financials are based on the most recent Mortgage that was taken out on this home.
Original Mortgage
$148,000
Interest Rate
2.88%
Mortgage Type
New Conventional
Purchase Details
Closed on
Dec 15, 2000
Sold by
Turner Kathleen M and Klehr Kathleen M
Bought by
Klehr Michael J
Purchase Details
Closed on
Jun 26, 2000
Sold by
Gardner Kevin and Gardner Donna
Bought by
Klehr Michael J
Create a Home Valuation Report for This Property
The Home Valuation Report is an in-depth analysis detailing your home's value as well as a comparison with similar homes in the area
Home Values in the Area
Average Home Value in this Area
Purchase History
| Date | Buyer | Sale Price | Title Company |
|---|---|---|---|
| Davis Jeremy B | -- | None Listed On Document | |
| Ha Helena | -- | Kansas City Title Icnc | |
| Ha Helena | -- | Kansas City Title | |
| Klehr Michael J | -- | -- | |
| Klehr Michael J | -- | Coffelt Land Title |
Source: Public Records
Mortgage History
| Date | Status | Borrower | Loan Amount |
|---|---|---|---|
| Open | Davis Jeremy B | $207,100 | |
| Previous Owner | Ha Helena | $148,000 |
Source: Public Records
Tax History
| Year | Tax Paid | Tax Assessment Tax Assessment Total Assessment is a certain percentage of the fair market value that is determined by local assessors to be the total taxable value of land and additions on the property. | Land | Improvement |
|---|---|---|---|---|
| 2025 | $2,692 | $29,399 | $3,040 | $26,359 |
| 2024 | $2,692 | $35,150 | $1,813 | $33,337 |
| 2023 | $2,643 | $35,150 | $4,410 | $30,740 |
| 2022 | $1,888 | $22,230 | $1,914 | $20,316 |
| 2021 | $1,886 | $22,230 | $1,914 | $20,316 |
| 2020 | $1,670 | $19,466 | $1,914 | $17,552 |
| 2019 | $1,619 | $19,466 | $1,914 | $17,552 |
| 2018 | $922,406 | $17,859 | $1,914 | $15,945 |
| 2017 | $1,531 | $17,859 | $1,914 | $15,945 |
| 2016 | $1,503 | $17,595 | $1,914 | $15,681 |
| 2014 | $1,692 | $19,684 | $1,914 | $17,770 |
Source: Public Records
Map
Nearby Homes
- 1100 NE Goshen Ct
- 4517 NE Fairway Homes Dr
- 709 NE Lake Pointe Dr
- 1108 NE Franklin Dr
- 708 NE Lake Pointe Dr
- 1225 NE Kenwood Dr
- 1317 NE Kenwood Dr
- 1305 NE Goshen Dr
- 607 NE Pinehurst St
- 717 NE Silverleaf Place
- 704 NE Ashmont Place
- 4910 NE Pebble Beach St
- 4335 NE Hideaway Dr
- 4017 NE Sagamore Dr
- 4005 NE Apple Grove Dr
- 1500 NE Park Springs Terrace
- 792 NE Algonquin St
- 5217 NE Holiday Dr
- 4332 NE Hideaway Dr
- 1508 NE Park Springs Terrace
- 1017D NE Whispering Winds Cir
- 1017 NE Whispering Winds Cir
- 1017A NE Whispering Winds Cir
- 1017C NE Whispering Winds Cir
- 1017 NE Whispering Winds Cir Unit D
- 1017 NE Whispering Winds Cir Unit B
- 4601A NE Whispering Winds Dr
- 1013D NE Whispering Winds Cir
- 4601B NE Whispering Winds Dr
- 1013 NE Whispering Winds Cir Unit C
- 4601 NE Whispering Winds Dr
- 1013C NE Whispering Winds Cir
- 4601C NE Whispering Winds Dr
- 1013B NE Whispering Winds Cir
- 4601D NE Whispering Winds Dr
- 1013A NE Whispering Winds Cir
- 4605A NE Whispering Winds Dr
- 1009D NE Whispering Winds Cir
- 4605B NE Whispering Winds Dr
- 1009C NE Whispering Winds Cir
Your Personal Tour Guide
Ask me questions while you tour the home.