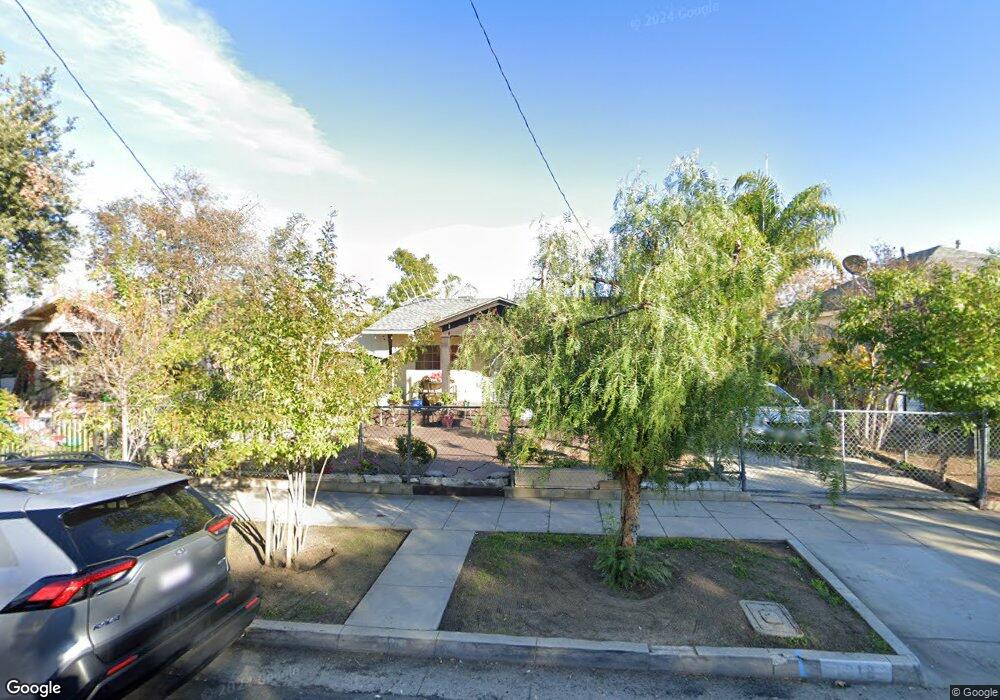
1018 Alta St Redlands, CA 92374
North Redlands NeighborhoodEstimated Value: $330,000 - $415,000
About This Home
This home is located at 1018 Alta St, Redlands, CA 92374 and is currently estimated at $381,714, approximately $489 per square foot. 1018 Alta St is a home located in San Bernardino County with nearby schools including Franklin Elementary School, Moore Middle School, and Redlands East Valley High School.
Ownership History
We collect this data history from publicly available records. To have your information removed, we recommend requesting removal directly through your county’s website.
Purchase Details
Home Financials for this Owner
Home Financials are based on the most recent Mortgage that was taken out on this home.Purchase Details
Home Financials for this Owner
Home Financials are based on the most recent Mortgage that was taken out on this home.Purchase Details
Home Financials for this Owner
Home Financials are based on the most recent Mortgage that was taken out on this home.Home Values in the Area
Average Home Value in this Area
Purchase History
We collect this data history from publicly available records. To have your information removed, we recommend requesting removal directly through your county’s website.
| Date | Buyer | Sale Price | Title Company |
|---|---|---|---|
| -- | Wfg Title Insurance | ||
| -- | Chicago Title Inland Empire | ||
| $114,500 | None Available |
Mortgage History
We collect this data history from publicly available records. To have your information removed, we recommend requesting removal directly through your county’s website.
| Date | Status | Borrower | Loan Amount |
|---|---|---|---|
| Previous Owner | $300,000 | ||
| Previous Owner | $246,489 | ||
| Previous Owner | $114,027 |
Tax History
We collect this data history from publicly available records. To have your information removed, we recommend requesting removal directly through your county’s website.
| Year | Tax Paid | Tax Assessment Tax Assessment Total Assessment is a certain percentage of the fair market value that is determined by local assessors to be the total taxable value of land and additions on the property. | Land | Improvement |
|---|---|---|---|---|
| 2025 | $1,820 | $143,818 | $43,145 | $100,673 |
| 2024 | $1,702 | $140,998 | $42,299 | $98,699 |
| 2023 | $1,700 | $138,234 | $41,470 | $96,764 |
| 2022 | $1,676 | $135,524 | $40,657 | $94,867 |
| 2021 | $1,618 | $132,867 | $39,860 | $93,007 |
| 2020 | $1,594 | $131,504 | $39,451 | $92,053 |
| 2019 | $1,548 | $128,925 | $38,677 | $90,248 |
| 2018 | $1,509 | $126,397 | $37,919 | $88,478 |
| 2017 | $1,495 | $123,918 | $37,175 | $86,743 |
| 2016 | $1,477 | $121,488 | $36,446 | $85,042 |
| 2015 | $1,465 | $119,664 | $35,899 | $83,765 |
| 2014 | $1,437 | $117,320 | $35,196 | $82,124 |
Map
- 1143 Orange St
- 323 E Colton Ave
- 1140 Oxford Dr
- 1002 Lombard Dr
- 215 W Lugonia Ave
- 610 E Lugonia Ave Unit 4
- 903 Webster St
- 605 E Lugonia Ave
- 1421 De Anza St
- 1132 Calhoun St
- 853 Railway Ln
- 873 Railway Ln
- 848 Railway Ln
- 1450 Washington St
- 1024 Lawton St
- 700 Church Place Unit 3
- 0 0 Unit IG26066829
- 887 Carlotta Ct
- 204 11th St
- 838 W Brockton Ave
Ask me questions while you tour the home.