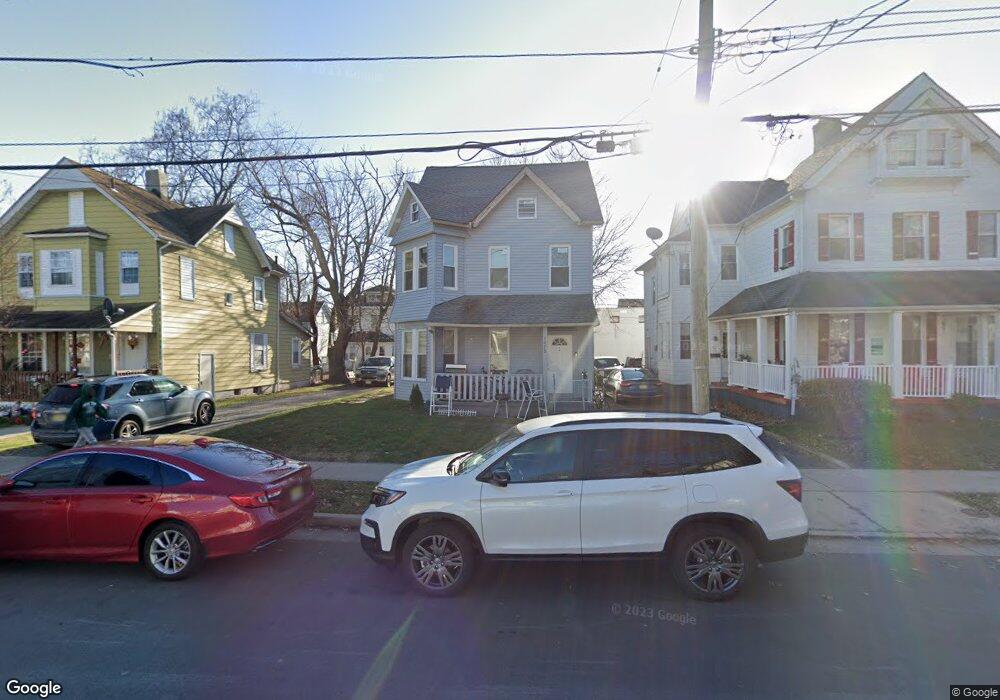
1018 Bangs Ave Asbury Park, NJ 07712
Estimated Value: $438,000 - $700,000
4
Beds
2
Baths
1,694
Sq Ft
$321/Sq Ft
Est. Value
About This Home
This home is located at 1018 Bangs Ave, Asbury Park, NJ 07712 and is currently estimated at $542,929, approximately $320 per square foot. 1018 Bangs Ave is a home located in Monmouth County with nearby schools including Asbury Park High School, Hope Academy Charter School, and Our Lady of Mount Carmel School.
Ownership History
Date
Name
Owned For
Owner Type
Purchase Details
Closed on
Sep 20, 2017
Sold by
Bertha Joseph
Bought by
Kskt Development Llc
Current Estimated Value
Purchase Details
Closed on
May 22, 2012
Sold by
Klimowicz Robert
Bought by
Bertha Joseph
Home Financials for this Owner
Home Financials are based on the most recent Mortgage that was taken out on this home.
Original Mortgage
$116,250
Interest Rate
3.9%
Mortgage Type
Commercial
Purchase Details
Closed on
Sep 9, 2008
Sold by
Homesales Inc
Bought by
Klimowicz Robert S
Purchase Details
Closed on
Apr 11, 2008
Sold by
Scully Jean and Chase Home Finance Llc
Bought by
Homesales Inc
Purchase Details
Closed on
Oct 7, 2002
Sold by
Perry Thermon
Bought by
Bilancione Salvatore
Home Financials for this Owner
Home Financials are based on the most recent Mortgage that was taken out on this home.
Original Mortgage
$89,919
Interest Rate
6.24%
Mortgage Type
Commercial
Create a Home Valuation Report for This Property
The Home Valuation Report is an in-depth analysis detailing your home's value as well as a comparison with similar homes in the area
Home Values in the Area
Average Home Value in this Area
Purchase History
| Date | Buyer | Sale Price | Title Company |
|---|---|---|---|
| Kskt Development Llc | $227,500 | -- | |
| Bertha Joseph | $155,000 | Scott Title Services Llc | |
| Klimowicz Robert S | $155,000 | Stewart Title Guaranty Co | |
| Homesales Inc | -- | Land Title Svcs Of Nj Inc | |
| Bilancione Salvatore | $99,910 | -- |
Source: Public Records
Mortgage History
| Date | Status | Borrower | Loan Amount |
|---|---|---|---|
| Previous Owner | Bertha Joseph | $116,250 | |
| Previous Owner | Bilancione Salvatore | $89,919 |
Source: Public Records
Tax History Compared to Growth
Tax History
| Year | Tax Paid | Tax Assessment Tax Assessment Total Assessment is a certain percentage of the fair market value that is determined by local assessors to be the total taxable value of land and additions on the property. | Land | Improvement |
|---|---|---|---|---|
| 2025 | $6,478 | $449,300 | $217,500 | $231,800 |
| 2024 | $5,836 | $409,500 | $172,800 | $236,700 |
| 2023 | $5,836 | $377,500 | $139,900 | $237,600 |
| 2022 | $4,773 | $332,600 | $116,600 | $216,000 |
| 2021 | $4,773 | $302,100 | $105,900 | $196,200 |
| 2020 | $4,188 | $265,900 | $101,100 | $164,800 |
| 2019 | $3,780 | $229,100 | $96,300 | $132,800 |
| 2018 | $3,838 | $215,400 | $87,500 | $127,900 |
| 2017 | $3,253 | $156,400 | $70,300 | $86,100 |
| 2016 | $3,210 | $149,700 | $66,300 | $83,400 |
| 2015 | $3,237 | $146,200 | $65,000 | $81,200 |
| 2014 | $3,190 | $147,200 | $75,000 | $72,200 |
Source: Public Records
Map
Nearby Homes
- 1407 Mattison Ave
- 1015 Mattison Ave
- 1001 Bangs Ave
- 916 Monroe Ave
- 603 Langford St
- 603 Comstock St
- 1111 Sewall Ave
- 1102 1/2 Asbury Ave
- 514 Prospect Ave
- 1123 Sewall Ave
- 1235 Washington Ave
- 614 Pine St
- 644 Church St
- 532 Prospect Ave
- 1255 Washington Ave
- 606 Asbury Ave
- 128 Dewitt Ave
- 126 Dewitt Ave
- 218 3rd Ave Unit 204
- 1405 Mattison Ave
- 1012 Bangs Ave
- 1022 Bangs Ave
- 1024 Bangs Ave
- 1010 Bangs Ave
- 1026 Bangs Ave
- 1015 Mattison Ave Unit A
- 1015 Mattison Ave Unit B
- 1028 Bangs Ave
- 1027 Mattison Ave
- 1006 Bangs Ave
- 1009 Mattison Ave
- 1030 Bangs Ave
- 1007 Mattison Ave
- 1019 Bangs Ave
- 1029 Mattison Ave
- 1029 Mattison Ave Unit 3
- 1023 Bangs Ave
- 1015 Bangs Ave
- 1015 Bangs Ave Unit REAR
- 1032 Bangs Ave Unit 1034