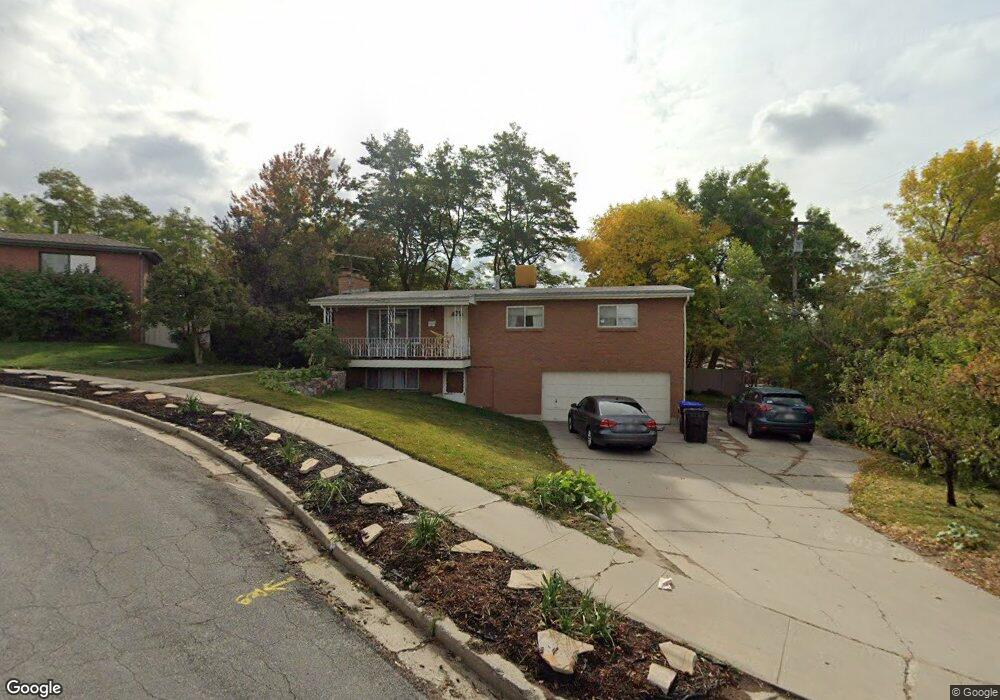
1018 E 800 N Bountiful, UT 84010
Estimated Value: $462,000 - $542,000
3
Beds
2
Baths
1,739
Sq Ft
$288/Sq Ft
Est. Value
About This Home
This home is located at 1018 E 800 N, Bountiful, UT 84010 and is currently estimated at $500,620, approximately $287 per square foot. 1018 E 800 N is a home located in Davis County with nearby schools including Holbrook Elementary School, Bountiful Junior High School, and Bountiful High School.
Ownership History
Date
Name
Owned For
Owner Type
Purchase Details
Closed on
Nov 8, 2024
Sold by
Evans Lisa
Bought by
Orozco Jesus Jose and Orozco-Anguiano Rosalinda
Current Estimated Value
Home Financials for this Owner
Home Financials are based on the most recent Mortgage that was taken out on this home.
Original Mortgage
$328,000
Outstanding Balance
$324,372
Interest Rate
6.08%
Mortgage Type
New Conventional
Estimated Equity
$176,248
Purchase Details
Closed on
Jun 17, 2022
Sold by
Shrinkyquilter Homes Llc
Bought by
Evans Lisa
Home Financials for this Owner
Home Financials are based on the most recent Mortgage that was taken out on this home.
Original Mortgage
$172,000
Interest Rate
4.81%
Purchase Details
Closed on
May 14, 2021
Sold by
Best Christy and The Residence Trust
Bought by
Shrinkyquilter Homes Llc
Purchase Details
Closed on
Jul 26, 2013
Sold by
Best Wayne O and Best Lillian G
Bought by
Best Christy
Create a Home Valuation Report for This Property
The Home Valuation Report is an in-depth analysis detailing your home's value as well as a comparison with similar homes in the area
Purchase History
| Date | Buyer | Sale Price | Title Company |
|---|---|---|---|
| Orozco Jesus Jose | -- | None Listed On Document | |
| Orozco Jesus Jose | -- | None Listed On Document | |
| Evans Lisa | -- | None Listed On Document | |
| Shrinkyquilter Homes Llc | -- | Us Title Company O | |
| Best Christy | -- | None Available |
Source: Public Records
Mortgage History
| Date | Status | Borrower | Loan Amount |
|---|---|---|---|
| Open | Orozco Jesus Jose | $328,000 | |
| Closed | Orozco Jesus Jose | $328,000 | |
| Previous Owner | Evans Lisa | $172,000 |
Source: Public Records
Tax History
| Year | Tax Paid | Tax Assessment Tax Assessment Total Assessment is a certain percentage of the fair market value that is determined by local assessors to be the total taxable value of land and additions on the property. | Land | Improvement |
|---|---|---|---|---|
| 2025 | $2,810 | $251,350 | $135,412 | $115,938 |
| 2024 | $2,637 | $245,300 | $124,825 | $120,475 |
| 2023 | $2,529 | $427,000 | $226,641 | $200,359 |
| 2022 | $2,665 | $450,000 | $219,504 | $230,496 |
| 2021 | $1,229 | $311,000 | $180,863 | $130,137 |
| 2020 | $1,949 | $275,000 | $164,675 | $110,325 |
| 2019 | $1,979 | $273,000 | $161,107 | $111,893 |
| 2018 | $1,812 | $245,000 | $149,809 | $95,191 |
| 2016 | $186 | $116,600 | $48,286 | $68,314 |
| 2015 | $1,564 | $108,240 | $48,286 | $59,954 |
| 2014 | $64 | $112,002 | $48,286 | $63,716 |
| 2013 | -- | $112,698 | $51,700 | $60,998 |
Source: Public Records
Map
Nearby Homes
- 908 Northern Hills Dr Unit 3
- 933 Northern Hills Cir
- 662 E 1200 N
- 1342 Northridge Dr
- 683 E 100 N
- 1342 E Skyline Dr N Unit 30
- 513 N 400 E Unit 14B
- 1138 Briggs Dr
- 345 N 400 E
- 453 N 400 E Unit 7-D
- 610 E Pages Ln
- 111 Eagle Ridge Dr
- 214 E 1250 N
- 17 E 400 N Unit 19B
- 1420 N Main St
- 49 E 200 N Unit 4
- 41 E 200 N Unit 6
- 55 E 200 N Unit 2
- 51 E 200 N Unit 3
- 967 S Courtyard Ln
Your Personal Tour Guide
Ask me questions while you tour the home.