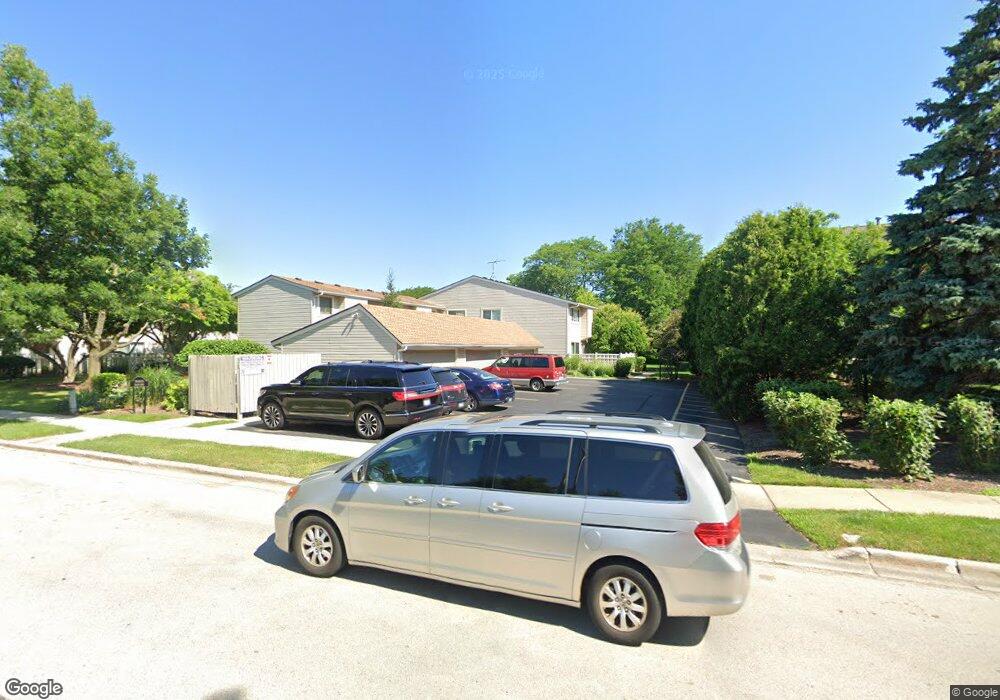
1018 E Thacker St Unit 31A6 Schaumburg, IL 60173
East Schaumburg NeighborhoodEstimated Value: $243,489 - $317,000
2
Beds
--
Bath
1,450
Sq Ft
$192/Sq Ft
Est. Value
About This Home
This home is located at 1018 E Thacker St Unit 31A6, Schaumburg, IL 60173 and is currently estimated at $277,872, approximately $191 per square foot. 1018 E Thacker St Unit 31A6 is a home located in Cook County with nearby schools including Fairview Elementary School, Helen Keller Junior High School, and J B Conant High School.
Create a Home Valuation Report for This Property
The Home Valuation Report is an in-depth analysis detailing your home's value as well as a comparison with similar homes in the area
Home Values in the Area
Average Home Value in this Area
Tax History
| Year | Tax Paid | Tax Assessment Tax Assessment Total Assessment is a certain percentage of the fair market value that is determined by local assessors to be the total taxable value of land and additions on the property. | Land | Improvement |
|---|---|---|---|---|
| 2025 | $3,495 | $24,011 | $4,280 | $19,731 |
| 2024 | $3,495 | $18,445 | $4,013 | $14,432 |
| 2023 | $3,338 | $18,445 | $4,013 | $14,432 |
| 2022 | $3,338 | $18,445 | $4,013 | $14,432 |
| 2021 | $2,245 | $13,402 | $3,544 | $9,858 |
| 2020 | $2,329 | $13,402 | $3,544 | $9,858 |
| 2019 | $2,343 | $14,915 | $3,544 | $11,371 |
| 2018 | $1,410 | $10,882 | $2,942 | $7,940 |
| 2017 | $1,420 | $10,882 | $2,942 | $7,940 |
| 2016 | $2,316 | $10,882 | $2,942 | $7,940 |
| 2015 | $2,316 | $10,366 | $2,608 | $7,758 |
| 2014 | $2,307 | $10,366 | $2,608 | $7,758 |
| 2013 | $2,230 | $10,366 | $2,608 | $7,758 |
Source: Public Records
Map
Nearby Homes
- 829 Heatherstone Dr
- 236 N Waterford Dr Unit 11B
- 601 Fairbanks Ct Unit V2
- 631 Schooner Point Unit 106B
- 745 Whalom Ln Unit 3A1
- 101 Bar Harbour Rd Unit 2
- 1252 Beechwood Ct Unit 1C
- 848 Newbury Ct
- 1527 Lexington Cir
- 52 Brookston Dr Unit D2
- 1532 Petersham Ln
- 640 Sturnbridge Ln
- 151 Brookston Dr Unit A2
- 18 Whitman Dr
- 244 Steeplechase Ct
- 267 Northbury Ct Unit D2
- 1325 Williamsburg Dr Unit C1
- 1223 Sandhurst Ct Unit D-1
- 1497 Whitman Ct
- 1220 Plum Tree Ct Unit 2D
- 1016 E Thacker St Unit 31A5
- 1014 E Thacker St Unit 31B4
- 1008 E Thacker St Unit 31C1
- 1012 E Thacker St Unit 31B3
- 1010 E Thacker St Unit 31C2
- 411 Verde Dr Unit 30C6
- 409 Verde Dr Unit 30C5
- 407 Verde Dr Unit 30B4
- 405 Verde Dr Unit 30B3
- 1021 Angela Ct
- 1021 Angela Ct Unit 1021
- 403 Verde Dr Unit 30A2
- 403 Verde Dr Unit 403
- 415 Verde Dr Unit 27C2
- 417 Verde Dr Unit 27B3
- 413 Verde Dr Unit 27C1
- 419 Verde Dr Unit 27B4
- 1023 Angela Ct
- 421 Verde Dr Unit 27D5
- 1022 Angela Ct
Your Personal Tour Guide
Ask me questions while you tour the home.