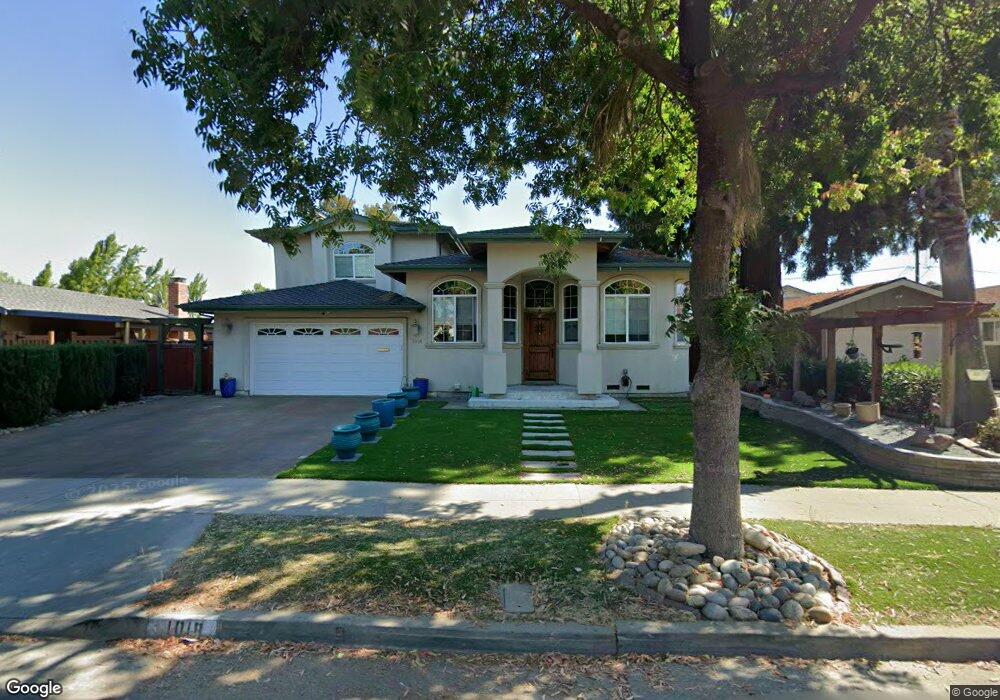
1018 Marilla Ave San Jose, CA 95129
Strawberry Park NeighborhoodEstimated Value: $2,416,000 - $3,133,000
4
Beds
3
Baths
2,715
Sq Ft
$1,020/Sq Ft
Est. Value
About This Home
This home is located at 1018 Marilla Ave, San Jose, CA 95129 and is currently estimated at $2,769,376, approximately $1,020 per square foot. 1018 Marilla Ave is a home located in Santa Clara County with nearby schools including Easterbrook Discovery, Prospect High School, and Trust Montessori School.
Ownership History
Date
Name
Owned For
Owner Type
Purchase Details
Closed on
Jan 13, 1999
Sold by
Yin Leung Samuel C and Kay Estella B
Bought by
Naicker Udeshra D and Naidoo Saraswathi
Current Estimated Value
Home Financials for this Owner
Home Financials are based on the most recent Mortgage that was taken out on this home.
Original Mortgage
$296,000
Outstanding Balance
$67,888
Interest Rate
6.63%
Estimated Equity
$2,701,488
Purchase Details
Closed on
May 5, 1994
Sold by
Ancheta Amelia L
Bought by
Leung Samuel Chi Yin and Leung Estella Bo Kay
Home Financials for this Owner
Home Financials are based on the most recent Mortgage that was taken out on this home.
Original Mortgage
$200,000
Interest Rate
6.12%
Create a Home Valuation Report for This Property
The Home Valuation Report is an in-depth analysis detailing your home's value as well as a comparison with similar homes in the area
Home Values in the Area
Average Home Value in this Area
Purchase History
| Date | Buyer | Sale Price | Title Company |
|---|---|---|---|
| Naicker Udeshra D | $370,000 | Chicago Title Co | |
| Leung Samuel Chi Yin | $250,000 | Gateway Title Company |
Source: Public Records
Mortgage History
| Date | Status | Borrower | Loan Amount |
|---|---|---|---|
| Open | Naicker Udeshra D | $296,000 | |
| Previous Owner | Leung Samuel Chi Yin | $200,000 |
Source: Public Records
Tax History
| Year | Tax Paid | Tax Assessment Tax Assessment Total Assessment is a certain percentage of the fair market value that is determined by local assessors to be the total taxable value of land and additions on the property. | Land | Improvement |
|---|---|---|---|---|
| 2025 | $13,506 | $979,691 | $322,938 | $656,753 |
| 2024 | $13,506 | $960,482 | $316,606 | $643,876 |
| 2023 | $13,323 | $941,650 | $310,399 | $631,251 |
| 2022 | $13,125 | $923,187 | $304,313 | $618,874 |
| 2021 | $12,894 | $905,087 | $298,347 | $606,740 |
| 2020 | $12,630 | $895,807 | $295,288 | $600,519 |
| 2019 | $12,177 | $878,244 | $289,499 | $588,745 |
| 2018 | $11,883 | $861,024 | $283,823 | $577,201 |
| 2017 | $11,739 | $844,142 | $278,258 | $565,884 |
| 2016 | $11,125 | $827,591 | $272,802 | $554,789 |
| 2015 | $11,039 | $815,161 | $268,705 | $546,456 |
| 2014 | $10,437 | $799,194 | $263,442 | $535,752 |
Source: Public Records
Map
Nearby Homes
- 4628 Strawberry Park Dr
- 1103 Del Cambre Dr
- 841 Brentwood Dr
- 778 Rockwood Dr
- 5005 Doyle Rd
- 4569 Elmhurst Dr
- 4361 Blackford Ave
- 4792 Englewood Dr
- 544 Crimsonberry Way
- 1295 Flora Ave
- 992 Hibiscus Ln
- 821 Raintree Dr
- 988 Daffodil Way
- 494 Greendale Way
- 4774 Rio Rita Way
- 3871 Panda Ct
- 4425 Norwalk Dr Unit 29
- 4415 Norwalk Dr Unit 3
- 4049 Payne Ave
- 410 Auburn Way Unit 42
- 1004 Marilla Ave
- 1030 Marilla Ave
- 1017 Maraschino Dr
- 1031 Maraschino Dr
- 1003 Maraschino Dr
- 1040 Marilla Ave
- 4620 Williams Rd
- 4621 Blanco Dr
- 1041 Maraschino Dr
- 1050 Marilla Ave
- 1051 Maraschino Dr
- 4634 Williams Rd
- 4629 Blanco Dr
- 999 Cera Dr
- 1060 Marilla Ave
- 1016 Maraschino Dr
- 1061 Maraschino Dr
- 1002 Maraschino Dr
- 1055 Marilla Ave
- 4646 Williams Rd
Your Personal Tour Guide
Ask me questions while you tour the home.