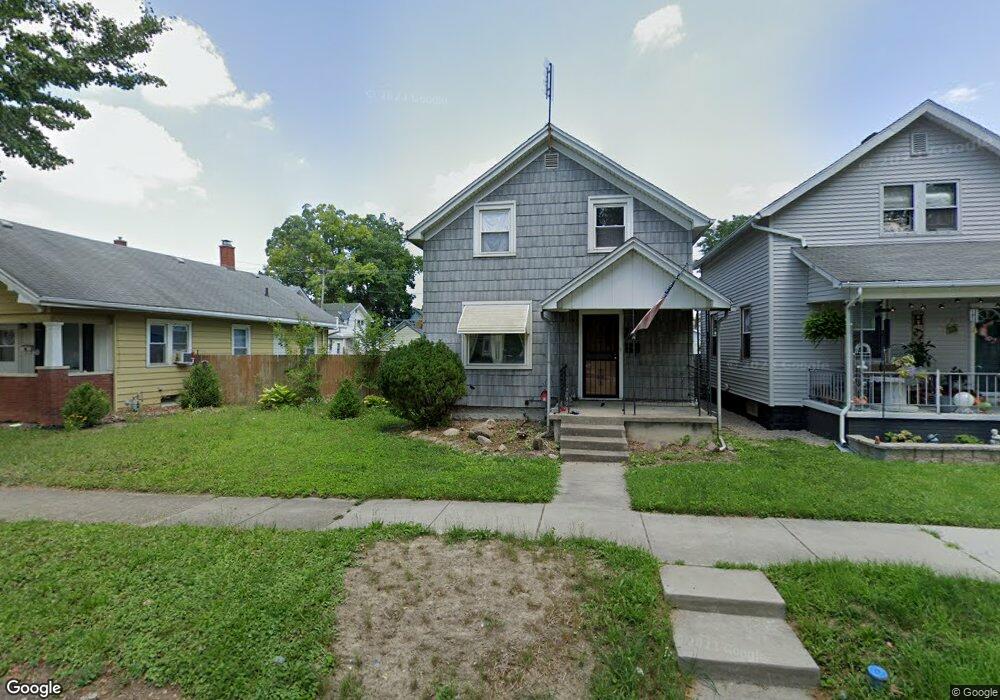
1018 Putnam St Fort Wayne, IN 46808
Hamilton NeighborhoodEstimated Value: $96,000 - $166,000
3
Beds
1
Bath
--
Sq Ft
4,051
Sq Ft Lot
About This Home
This home is located at 1018 Putnam St, Fort Wayne, IN 46808 and is currently estimated at $122,242. 1018 Putnam St is a home located in Allen County with nearby schools including Bloomingdale Elementary School, Lakeside Middle School, and North Side High School.
Ownership History
Date
Name
Owned For
Owner Type
Purchase Details
Closed on
Aug 27, 2025
Sold by
3 Rivers Real Estate Llc-S
Bought by
Kirkwood Jeremy Scot
Current Estimated Value
Purchase Details
Closed on
Jul 2, 2021
Sold by
Tjc Investment Properties Llc
Bought by
3 Rivers Real Estate Llc S
Home Financials for this Owner
Home Financials are based on the most recent Mortgage that was taken out on this home.
Original Mortgage
$461,389
Outstanding Balance
$347,997
Interest Rate
2.9%
Mortgage Type
Future Advance Clause Open End Mortgage
Estimated Equity
-$225,755
Purchase Details
Closed on
Nov 15, 2019
Sold by
Pamela Beck
Bought by
Conley Jack D
Purchase Details
Closed on
Nov 7, 2019
Sold by
Conley Jack D
Bought by
Tjc Investment Properties Llc
Purchase Details
Closed on
Feb 29, 2012
Sold by
Conley Jack D
Bought by
Conley Jack D and Beck Pamela
Create a Home Valuation Report for This Property
The Home Valuation Report is an in-depth analysis detailing your home's value as well as a comparison with similar homes in the area
Home Values in the Area
Average Home Value in this Area
Purchase History
| Date | Buyer | Sale Price | Title Company |
|---|---|---|---|
| Kirkwood Jeremy Scot | $100,020 | None Listed On Document | |
| 3 Rivers Real Estate Llc S | -- | Metropolitan Title Of In Llc | |
| Conley Jack D | -- | Centurion Land Title | |
| Tjc Investment Properties Llc | $50,000 | Centurion Land Title Inc | |
| Conley Jack D | -- | None Available |
Source: Public Records
Mortgage History
| Date | Status | Borrower | Loan Amount |
|---|---|---|---|
| Open | 3 Rivers Real Estate Llc S | $461,389 |
Source: Public Records
Tax History Compared to Growth
Tax History
| Year | Tax Paid | Tax Assessment Tax Assessment Total Assessment is a certain percentage of the fair market value that is determined by local assessors to be the total taxable value of land and additions on the property. | Land | Improvement |
|---|---|---|---|---|
| 2024 | $2,085 | $74,100 | $8,600 | $65,500 |
| 2022 | $1,349 | $60,000 | $7,500 | $52,500 |
| 2021 | $1,223 | $54,600 | $4,100 | $50,500 |
| 2020 | $1,337 | $61,100 | $5,500 | $55,600 |
| 2019 | $361 | $59,200 | $5,500 | $53,700 |
| 2018 | $0 | $54,000 | $5,500 | $48,500 |
| 2017 | -- | $53,800 | $5,500 | $48,300 |
| 2016 | -- | $51,800 | $5,500 | $46,300 |
| 2014 | $361 | $47,400 | $5,500 | $41,900 |
| 2013 | $361 | $48,300 | $5,500 | $42,800 |
Source: Public Records
Map
Nearby Homes
- 825 Putnam St
- 1731 Andrew St
- 808 Florence Ave
- 1214 Spring St
- 1511 Oakland St
- 2015 Hensch St
- 1115 W 4th St
- 1117 3rd St
- 2502 Sherman Blvd
- 1414 W 4th St
- 1522 Spring St
- Lots 21, 22, 25 Lawn Ave
- 604 W State Blvd
- 2604 Sherman Blvd
- 718 Irene Ave
- 714 Irene Ave
- 504 W State Blvd
- 1316 Sinclair St
- 415 Huffman St
- 1305 Sinclair St
- 1016 Putnam St
- 1022 Putnam St
- 1014 Putnam St
- 1024 Putnam St
- 1012 Putnam St
- 1812 Saint Marys Ave
- 1034 Putnam St
- 1816 Saint Marys Ave
- 1816 Saint Marys Ave Unit upstairs
- 1002 Putnam St
- 1015 Putnam St
- 1815 Oakland St
- 1019 Putnam St
- 1021 Archer Ave
- 1023 Putnam St
- 1013 Putnam St
- 1011 Archer Ave
- 1027 Putnam St
- 1025 Archer Ave
- 1005 Putnam St