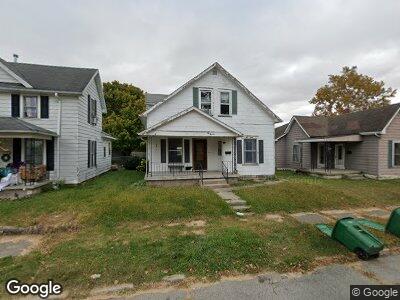
1018 S 17th St New Castle, IN 47362
New Castle NeighborhoodEstimated Value: $80,000 - $123,339
4
Beds
1
Bath
1,872
Sq Ft
$58/Sq Ft
Est. Value
About This Home
This home is located at 1018 S 17th St, New Castle, IN 47362 and is currently estimated at $107,835, approximately $57 per square foot. 1018 S 17th St is a home located in Henry County with nearby schools including Agape Learning Center.
Ownership History
Date
Name
Owned For
Owner Type
Purchase Details
Closed on
Mar 7, 2023
Sold by
Sami Home Offers In Llc
Bought by
Caixba Maria Eugenia Salazar Velasco Fra
Current Estimated Value
Purchase Details
Closed on
Feb 16, 2007
Sold by
Beacon Enterprises Llc
Bought by
Shelby Roscoe R and Shelby Amanda L
Home Financials for this Owner
Home Financials are based on the most recent Mortgage that was taken out on this home.
Original Mortgage
$50,000
Interest Rate
6.27%
Mortgage Type
Purchase Money Mortgage
Create a Home Valuation Report for This Property
The Home Valuation Report is an in-depth analysis detailing your home's value as well as a comparison with similar homes in the area
Home Values in the Area
Average Home Value in this Area
Purchase History
| Date | Buyer | Sale Price | Title Company |
|---|---|---|---|
| Caixba Maria Eugenia Salazar Velasco Fra | $70,000 | Hocker Title | |
| Sami Home Offers In Llc | $70,000 | Hocker Title | |
| Shelby Roscoe R | -- | None Available |
Source: Public Records
Mortgage History
| Date | Status | Borrower | Loan Amount |
|---|---|---|---|
| Previous Owner | Shelby Roscoe R | $50,000 |
Source: Public Records
Tax History Compared to Growth
Tax History
| Year | Tax Paid | Tax Assessment Tax Assessment Total Assessment is a certain percentage of the fair market value that is determined by local assessors to be the total taxable value of land and additions on the property. | Land | Improvement |
|---|---|---|---|---|
| 2024 | $709 | $77,900 | $9,400 | $68,500 |
| 2023 | $551 | $61,700 | $9,400 | $52,300 |
| 2022 | $440 | $52,800 | $6,300 | $46,500 |
| 2021 | $377 | $45,800 | $6,300 | $39,500 |
| 2020 | $377 | $43,800 | $6,300 | $37,500 |
| 2019 | $353 | $42,400 | $6,300 | $36,100 |
| 2018 | $317 | $40,800 | $5,700 | $35,100 |
| 2017 | $293 | $40,300 | $5,700 | $34,600 |
| 2016 | $344 | $45,800 | $6,700 | $39,100 |
| 2014 | $289 | $47,500 | $8,300 | $39,200 |
| 2013 | $289 | $45,700 | $8,300 | $37,400 |
Source: Public Records
Map
Nearby Homes