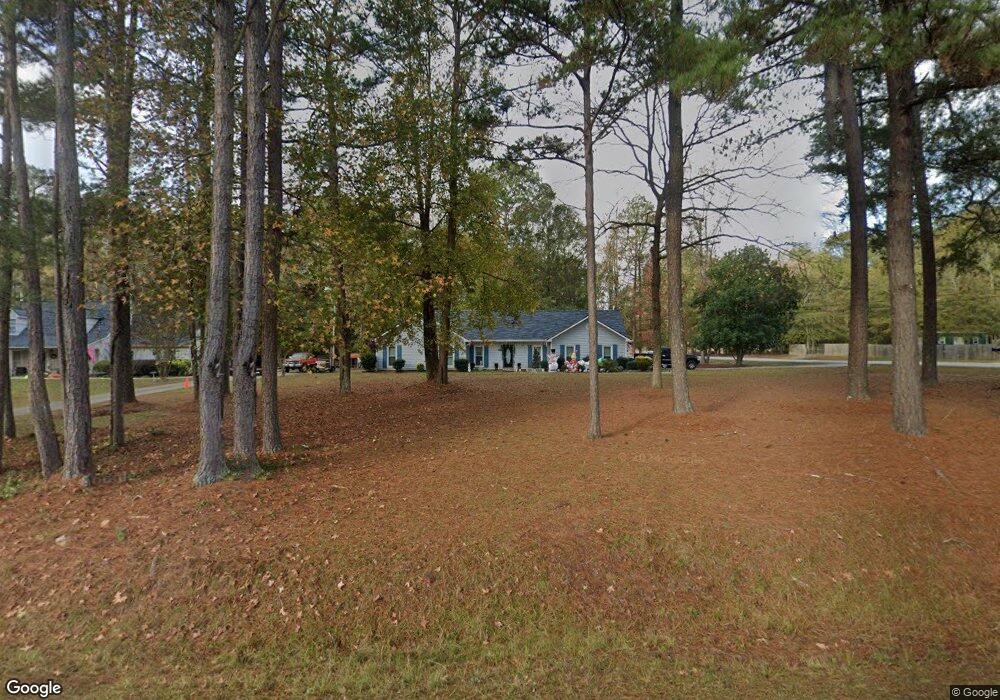
1018 Stewart Rd Lagrange, GA 30241
Estimated Value: $236,000 - $259,000
3
Beds
2
Baths
1,477
Sq Ft
$166/Sq Ft
Est. Value
About This Home
This home is located at 1018 Stewart Rd, Lagrange, GA 30241 and is currently estimated at $244,914, approximately $165 per square foot. 1018 Stewart Rd is a home located in Troup County with nearby schools including Callaway Elementary School, Hogansville Elementary School, and Callaway Middle School.
Ownership History
Date
Name
Owned For
Owner Type
Purchase Details
Closed on
Sep 26, 2025
Sold by
Broome Sally L
Bought by
Lackey Adena
Current Estimated Value
Purchase Details
Closed on
Sep 30, 2019
Sold by
Means Mark D
Bought by
Broome Sally L
Home Financials for this Owner
Home Financials are based on the most recent Mortgage that was taken out on this home.
Original Mortgage
$133,000
Interest Rate
4.12%
Mortgage Type
New Conventional
Purchase Details
Closed on
May 28, 2004
Sold by
Laurel Scott B and Laurel Mccurry
Bought by
Means Mark D
Purchase Details
Closed on
Apr 10, 1996
Sold by
Wayne Bell B
Bought by
Laurel Scott B and Laurel Mccurry
Purchase Details
Closed on
May 23, 1988
Bought by
Wayne Bell B
Purchase Details
Closed on
Feb 1, 1987
Create a Home Valuation Report for This Property
The Home Valuation Report is an in-depth analysis detailing your home's value as well as a comparison with similar homes in the area
Purchase History
We collect this data history from publicly available records. To have your information removed, we recommend requesting removal directly through your county’s website.
| Date | Buyer | Sale Price | Title Company |
|---|---|---|---|
| Lackey Adena | $240,000 | -- | |
| Broome Sally L | $133,000 | -- | |
| Means Mark D | $112,000 | -- | |
| Laurel Scott B | $83,500 | -- | |
| Wayne Bell B | $73,000 | -- | |
| Wayne Bell B | $73,000 | -- | |
| -- | -- | -- |
Source: Public Records
Mortgage History
We collect this data history from publicly available records. To have your information removed, we recommend requesting removal directly through your county’s website.
| Date | Status | Borrower | Loan Amount |
|---|---|---|---|
| Previous Owner | Broome Sally L | $133,000 |
Source: Public Records
Tax History
| Year | Tax Paid | Tax Assessment Tax Assessment Total Assessment is a certain percentage of the fair market value that is determined by local assessors to be the total taxable value of land and additions on the property. | Land | Improvement |
|---|---|---|---|---|
| 2025 | $2,337 | $85,692 | $14,000 | $71,692 |
| 2024 | $2,136 | $78,332 | $14,000 | $64,332 |
| 2023 | $2,131 | $78,132 | $14,000 | $64,132 |
| 2022 | $1,016 | $65,012 | $10,000 | $55,012 |
| 2021 | $777 | $54,480 | $10,000 | $44,480 |
| 2020 | $1,304 | $54,480 | $10,000 | $44,480 |
| 2019 | $1,296 | $44,960 | $6,000 | $38,960 |
| 2018 | $1,237 | $43,000 | $6,000 | $37,000 |
| 2017 | $1,237 | $43,000 | $6,000 | $37,000 |
| 2016 | $1,216 | $42,317 | $6,000 | $36,317 |
| 2015 | $1,131 | $39,425 | $6,000 | $33,425 |
| 2014 | $1,080 | $37,666 | $6,000 | $31,666 |
| 2013 | -- | $39,872 | $6,000 | $33,872 |
Source: Public Records
Map
Nearby Homes
- 112 Greenbriar Trail
- 201 & 203 Alton Dr
- 2477 Upper Big Springs Rd
- 229 John Lovelace Rd
- 830 John Lovelace Rd
- 950 John Lovelace Rd
- 0 Lower Big Springs Rd Unit 26695797
- 91 Almond Rd
- 312 Preakness Dr
- 61 Nantucket Dr
- 208 N Davis Rd
- 142 Carr Rd
- 37.23 ACRES / 0 Smokey Rd
- 429 Jasmine Cir
- 961 Thrash Rd Unit LOT 2
- 957 Thrash Rd Unit LOT 1
- 311 Mourning Ct Unit LOT 33
- 103 Beaver Creek Way
- 103 Beaver Creek Way Unit 247
- 101 Beaver Creek Way
- 1032 Stewart Rd
- 998 Stewar Lagrange
- 998 Stewart Rd
- 151 Greenbriar Trail
- 101 Silver Leaf Dr
- 149 Greenbriar Trail
- 984 Stewart Rd
- 1003 Stewart Rd
- 987 Stewart Rd
- 103 Silver Leaf Dr
- 147 Greenbriar Trail
- 970 Stewart Rd
- 977 Stewart Rd
- 100 Silver Leaf Dr
- 105 Silver Leaf Dr
- 1049 Stewart Rd
- 145 Greenbriar Trail
- 956 Stewart Rd
- 107 Silver Leaf Dr
- 102 Silver Leaf Dr
Your Personal Tour Guide
Ask me questions while you tour the home.