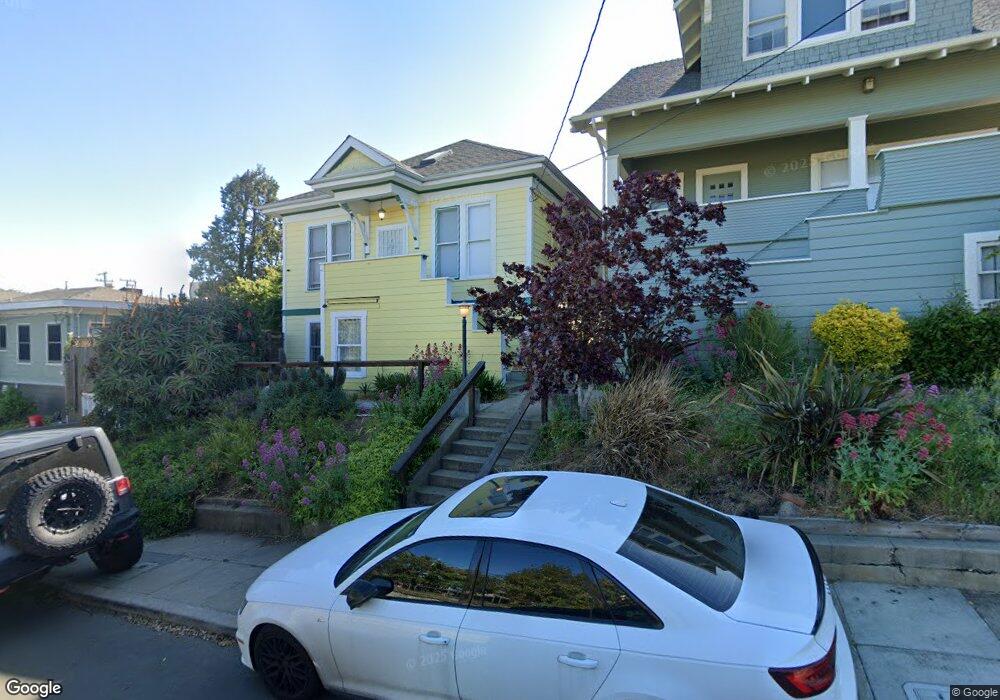
1018 Sutter St Vallejo, CA 94590
Downtown Vallejo NeighborhoodEstimated Value: $450,049 - $593,000
3
Beds
2
Baths
1,514
Sq Ft
$351/Sq Ft
Est. Value
About This Home
This home is located at 1018 Sutter St, Vallejo, CA 94590 and is currently estimated at $532,012, approximately $351 per square foot. 1018 Sutter St is a home located in Solano County with nearby schools including Lincoln Elementary School, Vallejo High School, and Caliber: ChangeMakers Academy.
Ownership History
Date
Name
Owned For
Owner Type
Purchase Details
Closed on
Jul 1, 2025
Sold by
Powers-Rutledge Heather M
Bought by
2025 Heather Powers-Rutledge Trust and Powers-Rutledge
Current Estimated Value
Purchase Details
Closed on
Jul 6, 2023
Sold by
Rutledge Matthew M and Rutledge Heather
Bought by
Powers-Rutledge Heather M
Purchase Details
Closed on
Aug 13, 2014
Sold by
Rutledge Matthew M and Powers Rutledge Heather
Bought by
2014 Rutledge Powers Family Trust and Powers Rutledge Heather
Purchase Details
Closed on
Oct 12, 1999
Sold by
Lemley Ina O
Bought by
Rutledge Matthew M and Powers Rutledge Heather
Home Financials for this Owner
Home Financials are based on the most recent Mortgage that was taken out on this home.
Original Mortgage
$111,450
Interest Rate
7.77%
Purchase Details
Closed on
Mar 14, 1995
Sold by
Lemley Ina O
Bought by
Lemley Ina O
Create a Home Valuation Report for This Property
The Home Valuation Report is an in-depth analysis detailing your home's value as well as a comparison with similar homes in the area
Home Values in the Area
Average Home Value in this Area
Purchase History
| Date | Buyer | Sale Price | Title Company |
|---|---|---|---|
| 2025 Heather Powers-Rutledge Trust | -- | None Listed On Document | |
| Powers-Rutledge Heather M | -- | None Listed On Document | |
| 2014 Rutledge Powers Family Trust | -- | None Available | |
| Rutledge Matthew M | $115,000 | Fidelity National Title Co | |
| Lemley Ina O | -- | -- |
Source: Public Records
Mortgage History
| Date | Status | Borrower | Loan Amount |
|---|---|---|---|
| Previous Owner | Rutledge Matthew M | $111,450 |
Source: Public Records
Tax History
| Year | Tax Paid | Tax Assessment Tax Assessment Total Assessment is a certain percentage of the fair market value that is determined by local assessors to be the total taxable value of land and additions on the property. | Land | Improvement |
|---|---|---|---|---|
| 2025 | $3,411 | $205,696 | $30,731 | $174,965 |
| 2024 | $3,411 | $208,946 | $30,129 | $178,817 |
| 2023 | $3,191 | $197,711 | $29,539 | $168,172 |
| 2022 | $3,089 | $193,835 | $28,961 | $164,874 |
| 2021 | $3,020 | $190,036 | $28,394 | $161,642 |
| 2020 | $3,022 | $188,088 | $28,103 | $159,985 |
| 2019 | $2,920 | $184,401 | $27,552 | $156,849 |
| 2018 | $2,726 | $180,786 | $27,012 | $153,774 |
| 2017 | $2,594 | $177,242 | $26,483 | $150,759 |
| 2016 | $2,024 | $173,767 | $25,964 | $147,803 |
| 2015 | $1,998 | $171,157 | $25,574 | $145,583 |
| 2014 | $1,970 | $167,806 | $25,074 | $142,732 |
Source: Public Records
Map
Nearby Homes
- 703 Capitol St
- 915 Napa St
- 734 Florida St
- 844 Kentucky St
- 1322 Sutter St
- 1715 Sonoma Blvd Unit 212
- 729 Ohio St
- 908 Kentucky St
- 902 Kentucky St
- 314 Ohio St
- 620 Kentucky St
- 939 Ohio St
- 520 Napa St
- 1518 Sonoma Blvd
- 2104 Marin St
- 918 Alameda St
- 125 Broadway St
- 1121 Ohio St
- 601 Alabama St
- 302 Carolina St
- 711 1/2 Carolina St
- 1030 Sutter St
- 709 Carolina St
- 715 Carolina St
- 1012 Sutter St
- 1029 Sutter St
- 1008 Sutter St
- 721 Carolina St
- 710 Capitol St
- 1021 Sutter St
- 720 Capitol St
- 727 Carolina St
- 700 Capitol St
- 700 Carolina St
- 637 Carolina St
- 714 Carolina St
- 1001 Sutter St
- 639 Carolina St
- 710 Carolina St
- 642 Capitol St
Your Personal Tour Guide
Ask me questions while you tour the home.