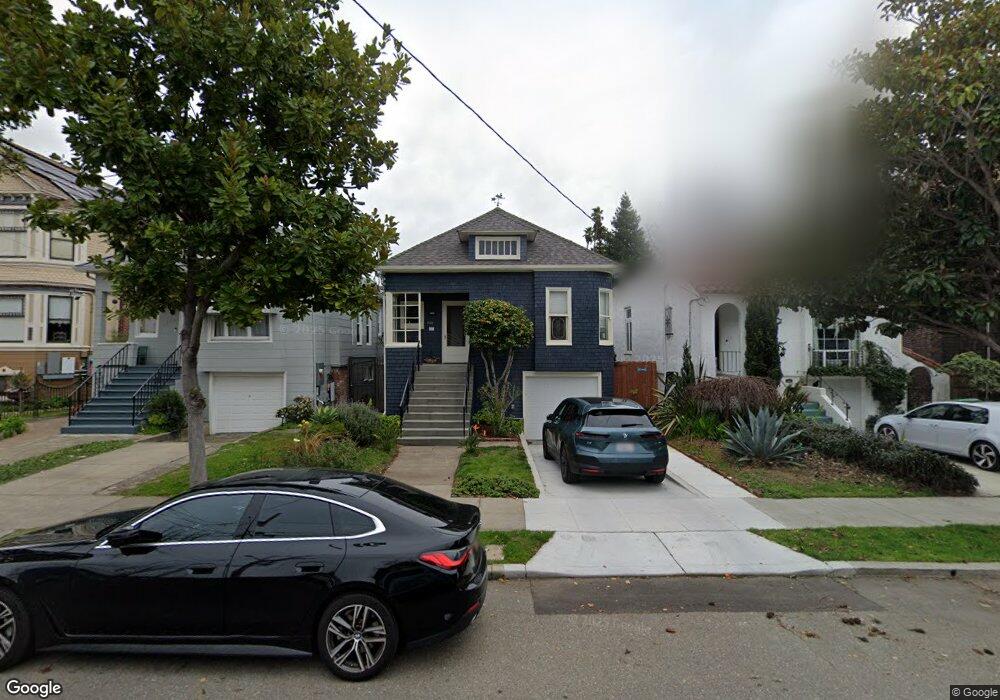
1018 Union St Alameda, CA 94501
South Shore NeighborhoodEstimated Value: $1,185,000 - $1,468,761
3
Beds
1
Bath
1,361
Sq Ft
$988/Sq Ft
Est. Value
About This Home
This home is located at 1018 Union St, Alameda, CA 94501 and is currently estimated at $1,345,190, approximately $988 per square foot. 1018 Union St is a home located in Alameda County with nearby schools including Franklin Elementary, Will C. Wood Middle School, and Alameda High School.
Ownership History
Date
Name
Owned For
Owner Type
Purchase Details
Closed on
Jun 10, 2022
Sold by
Andrea Johnson
Bought by
Andrea R Johnson Living Trust
Current Estimated Value
Purchase Details
Closed on
Sep 13, 2016
Sold by
Landes Michele J and Markiel Rand M
Bought by
Johnson Andrea and Ahn Christine
Home Financials for this Owner
Home Financials are based on the most recent Mortgage that was taken out on this home.
Original Mortgage
$625,500
Interest Rate
3.45%
Mortgage Type
New Conventional
Purchase Details
Closed on
Jun 15, 2016
Sold by
Landes Michele J and Markiel Rand M
Bought by
Wanda J Markiel 2009 Revocable Trust
Purchase Details
Closed on
Jun 10, 2009
Sold by
Markiel Wanda and Markiel Family Trust
Bought by
Markiel Wanda and Markiel Family Trust
Purchase Details
Closed on
Jan 26, 2009
Sold by
Markiel Chester L and Markiel Wanda J
Bought by
Markiel Chester L and Markiel Wanda
Create a Home Valuation Report for This Property
The Home Valuation Report is an in-depth analysis detailing your home's value as well as a comparison with similar homes in the area
Home Values in the Area
Average Home Value in this Area
Purchase History
| Date | Buyer | Sale Price | Title Company |
|---|---|---|---|
| Andrea R Johnson Living Trust | -- | Lerman Law Partners Llp | |
| Christine Ahn Living Trust | -- | Lerman Law Partners Llp | |
| Johnson Andrea | $900,000 | First American Title Company | |
| Wanda J Markiel 2009 Revocable Trust | -- | None Available | |
| Markiel Wanda | -- | None Available | |
| Markiel Chester L | -- | None Available | |
| Markiel Chester L | -- | None Available |
Source: Public Records
Mortgage History
| Date | Status | Borrower | Loan Amount |
|---|---|---|---|
| Previous Owner | Johnson Andrea | $625,500 |
Source: Public Records
Tax History
| Year | Tax Paid | Tax Assessment Tax Assessment Total Assessment is a certain percentage of the fair market value that is determined by local assessors to be the total taxable value of land and additions on the property. | Land | Improvement |
|---|---|---|---|---|
| 2025 | $16,510 | $1,190,503 | $313,351 | $884,152 |
| 2024 | $16,510 | $1,167,028 | $307,208 | $866,820 |
| 2023 | $13,730 | $1,003,950 | $301,185 | $702,765 |
| 2022 | $13,414 | $977,266 | $295,280 | $688,986 |
| 2021 | $13,071 | $957,970 | $289,491 | $675,479 |
| 2020 | $12,908 | $955,080 | $286,524 | $668,556 |
| 2019 | $12,426 | $936,360 | $280,908 | $655,452 |
| 2018 | $12,106 | $918,000 | $275,400 | $642,600 |
| 2017 | $11,525 | $900,000 | $270,000 | $630,000 |
| 2016 | $2,020 | $60,062 | $48,050 | $12,012 |
| 2015 | $2,004 | $59,161 | $47,329 | $11,832 |
| 2014 | $1,960 | $58,002 | $46,402 | $11,600 |
Source: Public Records
Map
Nearby Homes
- 610 Grand St
- 1822 Clinton Ave
- 2000 Clinton Ave
- 1211 Paru St
- 2050 Central Ave
- 1500 Alameda Ave Unit G
- 1401 Cottage St Unit D
- 1203 Benton St
- 2118 Alameda Ave
- 2031 Otis Dr Unit H
- 1122 Bay St
- 1604 Schiller St
- 1707 Lincoln Ave
- 2106 Otis Dr Unit A
- 2137 Otis Dr Unit 111
- 2200 San Jose Ave
- 2214 Clinton Ave
- 325 Kitty Hawk Rd Unit 207
- 1726 Eagle Ave
- 2136 Pacific Ave
- 1016 Union St
- 1020 Union St
- 1012 Union St
- 1024 Union St
- 1810 San Antonio Ave
- 1809 San Jose Ave
- 1004 Union St
- 1738 San Antonio Ave
- 1816 San Antonio Ave
- 1813 San Jose Ave
- 1803 San Antonio Ave
- 1734 San Antonio Ave
- 1820 San Antonio Ave
- 1817 San Jose Ave
- 1009 Union St
- 1003 Union St
- 1819 San Jose Ave
- 1732 San Antonio Ave
- 1809 San Antonio Ave
- 1815 San Antonio Ave
Your Personal Tour Guide
Ask me questions while you tour the home.