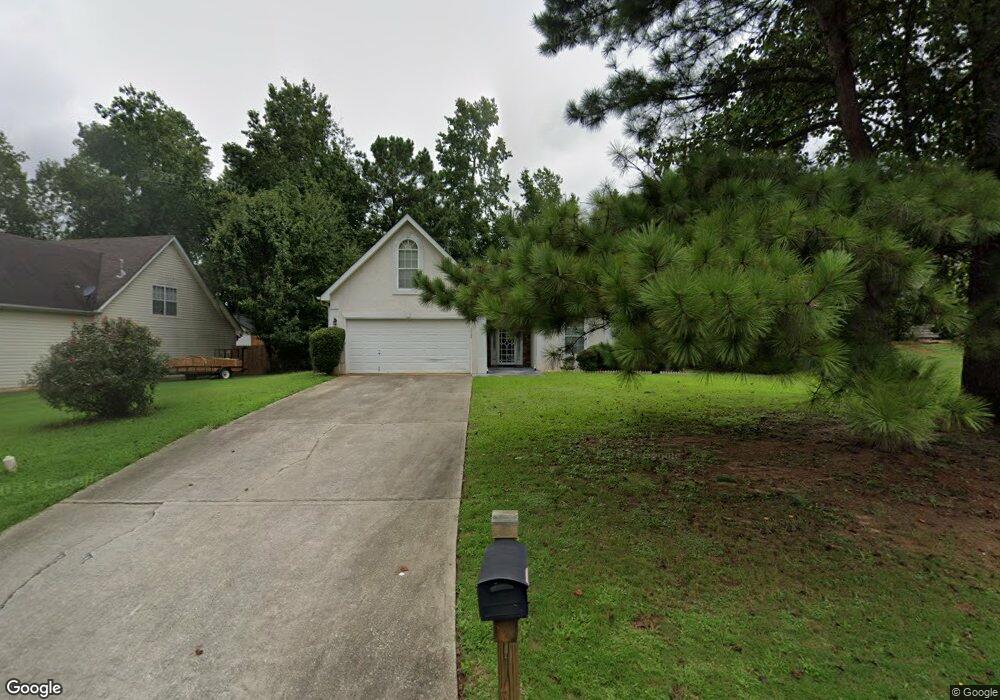
10189 Commons Crossing Unit 1 Jonesboro, GA 30238
Estimated Value: $239,000 - $257,000
3
Beds
2
Baths
1,412
Sq Ft
$175/Sq Ft
Est. Value
About This Home
This home is located at 10189 Commons Crossing Unit 1, Jonesboro, GA 30238 and is currently estimated at $247,365, approximately $175 per square foot. 10189 Commons Crossing Unit 1 is a home located in Clayton County with nearby schools including Kemp Primary School, Kemp Elementary School, and Mundys Mill Middle School.
Ownership History
Date
Name
Owned For
Owner Type
Purchase Details
Closed on
Aug 16, 2019
Sold by
Kirk Andre L
Bought by
Kirk Bobby L
Current Estimated Value
Home Financials for this Owner
Home Financials are based on the most recent Mortgage that was taken out on this home.
Original Mortgage
$144,620
Outstanding Balance
$126,920
Interest Rate
3.8%
Mortgage Type
VA
Estimated Equity
$120,445
Purchase Details
Closed on
May 2, 2003
Sold by
Kirk Andre L
Bought by
Kirk Andre L
Home Financials for this Owner
Home Financials are based on the most recent Mortgage that was taken out on this home.
Original Mortgage
$127,737
Interest Rate
5.86%
Mortgage Type
FHA
Purchase Details
Closed on
Apr 27, 2000
Sold by
Peachtree Homes Inc
Bought by
Marshall Thomas and Marshall Milagros
Home Financials for this Owner
Home Financials are based on the most recent Mortgage that was taken out on this home.
Original Mortgage
$111,389
Interest Rate
8.28%
Mortgage Type
VA
Create a Home Valuation Report for This Property
The Home Valuation Report is an in-depth analysis detailing your home's value as well as a comparison with similar homes in the area
Home Values in the Area
Average Home Value in this Area
Purchase History
| Date | Buyer | Sale Price | Title Company |
|---|---|---|---|
| Kirk Bobby L | $140,000 | -- | |
| Kirk Andre L | -- | -- | |
| Kirk Andre L | $129,800 | -- | |
| Marshall Thomas | $109,300 | -- |
Source: Public Records
Mortgage History
| Date | Status | Borrower | Loan Amount |
|---|---|---|---|
| Open | Kirk Bobby L | $144,620 | |
| Previous Owner | Kirk Andre L | $127,737 | |
| Previous Owner | Marshall Thomas | $111,389 |
Source: Public Records
Tax History Compared to Growth
Tax History
| Year | Tax Paid | Tax Assessment Tax Assessment Total Assessment is a certain percentage of the fair market value that is determined by local assessors to be the total taxable value of land and additions on the property. | Land | Improvement |
|---|---|---|---|---|
| 2024 | $1,686 | $94,920 | $8,000 | $86,920 |
| 2023 | $3,160 | $87,520 | $8,000 | $79,520 |
| 2022 | $1,207 | $70,760 | $8,000 | $62,760 |
| 2021 | $962 | $57,400 | $8,000 | $49,400 |
| 2020 | $898 | $53,024 | $8,000 | $45,024 |
| 2019 | $1,554 | $47,335 | $7,200 | $40,135 |
| 2018 | $1,400 | $43,542 | $7,200 | $36,342 |
| 2017 | $1,064 | $35,207 | $7,200 | $28,007 |
| 2016 | $903 | $31,268 | $7,200 | $24,068 |
| 2015 | $1,018 | $0 | $0 | $0 |
| 2014 | $1,081 | $36,209 | $7,200 | $29,009 |
Source: Public Records
Map
Nearby Homes
- 1091 Commons Ct Unit 2
- 10200 Commons Crossing Unit 1
- 10197 Hamilton Glen
- 1036 Walnut Creek Ln
- 1172 Faulkner Way
- 1253 Todiway Ct
- 10283 Richfield Ct
- 1241 Larkwood Dr
- 1296 Todiway Ct
- 9997 Point View Dr
- 1147 Dunivin Dr
- 10085 Brass Ring Rd
- 10410 Iron Gate Ln
- 10065 Brass Ring Rd
- 1352 Labelle St
- 1159 Bonita Way Unit 10
- 1224 Bonita Cir
- 10248 Briarbay Loop
- 1342 Winslow Dr
- 10411 Ivygate Terrace
- 10201 Commons Crossing
- 10213 Commons Crossing Unit 1
- 10173 Commons Crossing
- 1085 Commons Ct
- 10194 Commons Crossing
- 10186 Commons Crossing
- 1097 Commons Ct
- 10221 Commons Crossing Unit 1
- 1077 Commons Ct Unit 2
- 10161 Commons Crossing
- 10178 Commons Crossing Unit I
- 10206 Commons Crossing Unit 1
- 10212 Commons Crossing
- 10147 Commons Crossing
- 10212 The Commons
- 10172 Commons Crossing Unit 1
- 10229 Commons Crossing
- 1103 Commons Ct
- 1071 Commons Ct
- 10220 Commons Crossing