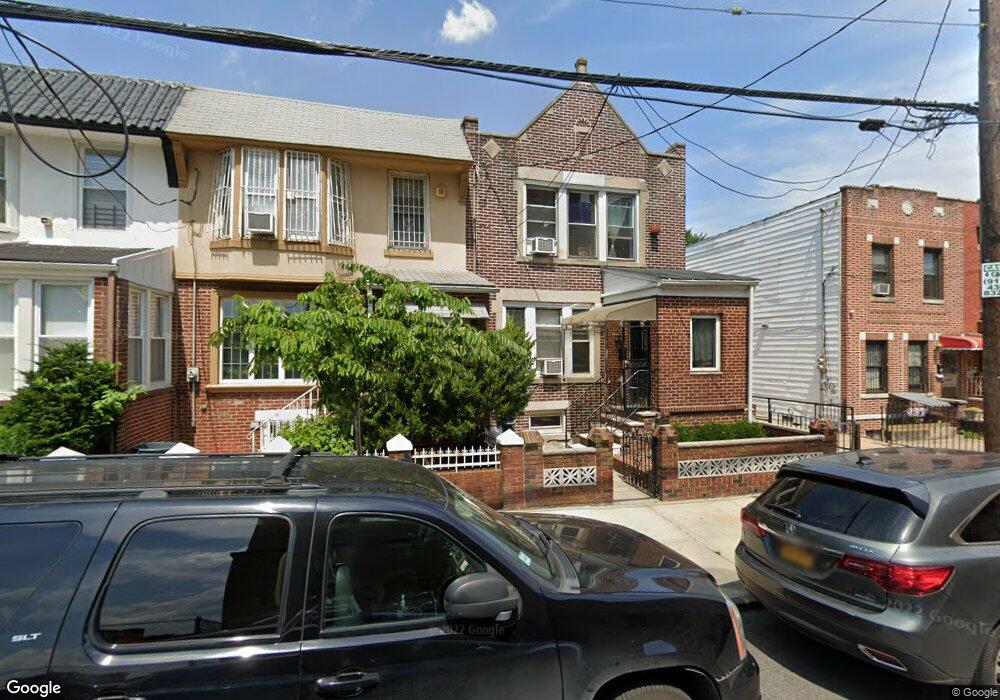
1019 58th St Brooklyn, NY 11219
Borough Park NeighborhoodEstimated Value: $1,420,000 - $1,596,785
6
Beds
2
Baths
1,440
Sq Ft
$1,037/Sq Ft
Est. Value
About This Home
This home is located at 1019 58th St, Brooklyn, NY 11219 and is currently estimated at $1,493,696, approximately $1,037 per square foot. 1019 58th St is a home located in Kings County with nearby schools including P.S. 105 The Blythebourne, I.S. 223 The Montauk, and Franklin Delano Roosevelt High School.
Ownership History
Date
Name
Owned For
Owner Type
Purchase Details
Closed on
Jun 18, 2024
Sold by
Huang Xue Jin
Bought by
Hoffmann Dina and Hoffmann Shaya
Current Estimated Value
Home Financials for this Owner
Home Financials are based on the most recent Mortgage that was taken out on this home.
Original Mortgage
$1,120,000
Outstanding Balance
$1,105,707
Interest Rate
7.02%
Mortgage Type
Purchase Money Mortgage
Estimated Equity
$387,989
Purchase Details
Closed on
Mar 14, 2014
Sold by
Marino John and The Estate Of Angela Marino
Bought by
Huang Xue Jin
Purchase Details
Closed on
Jun 29, 2004
Sold by
Domestic Development Corp
Bought by
Salomon Fritzgerald
Purchase Details
Closed on
Jun 21, 2004
Sold by
Domestic Development Corp
Bought by
Lawrence Michele D
Create a Home Valuation Report for This Property
The Home Valuation Report is an in-depth analysis detailing your home's value as well as a comparison with similar homes in the area
Home Values in the Area
Average Home Value in this Area
Purchase History
| Date | Buyer | Sale Price | Title Company |
|---|---|---|---|
| Hoffmann Dina | $1,400,000 | -- | |
| Huang Xue Jin | $700,000 | -- | |
| Huang Xue Jin | $700,000 | -- | |
| Salomon Fritzgerald | $456,300 | -- | |
| Lawrence Michele D | $456,300 | -- |
Source: Public Records
Mortgage History
| Date | Status | Borrower | Loan Amount |
|---|---|---|---|
| Open | Hoffmann Dina | $1,120,000 |
Source: Public Records
Tax History Compared to Growth
Tax History
| Year | Tax Paid | Tax Assessment Tax Assessment Total Assessment is a certain percentage of the fair market value that is determined by local assessors to be the total taxable value of land and additions on the property. | Land | Improvement |
|---|---|---|---|---|
| 2025 | $7,685 | $81,480 | $21,360 | $60,120 |
| 2024 | $7,685 | $73,740 | $21,360 | $52,380 |
| 2023 | $7,335 | $71,220 | $21,360 | $49,860 |
| 2022 | $6,866 | $70,980 | $21,360 | $49,620 |
| 2021 | $7,239 | $61,320 | $21,360 | $39,960 |
| 2020 | $3,533 | $63,000 | $21,360 | $41,640 |
| 2019 | $6,670 | $63,000 | $21,360 | $41,640 |
| 2018 | $6,135 | $30,097 | $10,834 | $19,263 |
| 2017 | $5,843 | $28,663 | $8,323 | $20,340 |
| 2016 | $5,730 | $28,663 | $9,755 | $18,908 |
| 2015 | $1,068 | $28,141 | $12,493 | $15,648 |
| 2014 | $1,068 | $26,572 | $13,993 | $12,579 |
Source: Public Records
Map
Nearby Homes
- 1012 57th St
- 941 57th St Unit 4B
- 941 57th St Unit 3A
- 941 57th St Unit 1A
- 935 57th St Unit 4B
- 928 57th St Unit 2R
- 928 57th St Unit 2F
- 928 57th St Unit 3R
- 928 57th St Unit 3F
- 928 57th St Unit 4F
- 928 57th St Unit 4R
- 969 55th St
- 933 56th St
- 943 60th St Unit 3A
- 949 60th St Unit C1
- 6005 Fort Hamilton Pkwy
- 956 54th St
- 946 54th St
- 915 60th St
- 869 57th St Unit 205