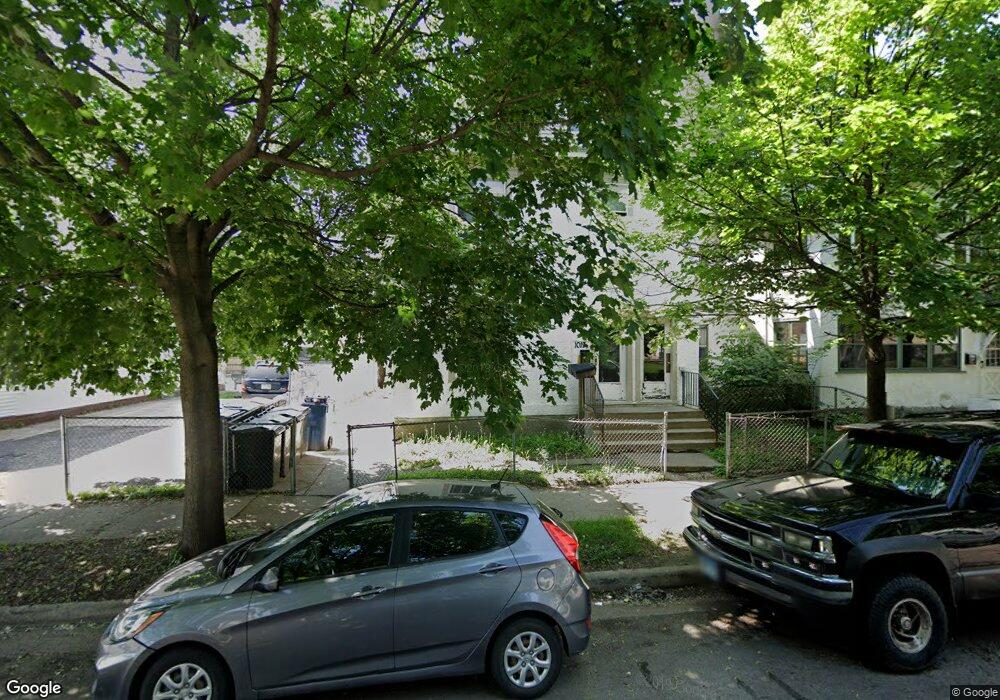
1019 E 21st St Minneapolis, MN 55404
Ventura Village NeighborhoodEstimated Value: $603,705
3
Beds
2
Baths
4,100
Sq Ft
$147/Sq Ft
Est. Value
About This Home
This home is located at 1019 E 21st St, Minneapolis, MN 55404 and is currently estimated at $603,705, approximately $147 per square foot. 1019 E 21st St is a home located in Hennepin County with nearby schools including Andersen Middle, South Senior High School, and Augsburg Fairview Academy.
Ownership History
Date
Name
Owned For
Owner Type
Purchase Details
Closed on
Jun 6, 2012
Sold by
New Life Properties Llc
Bought by
1019 21St Street East Llc
Current Estimated Value
Purchase Details
Closed on
Apr 6, 2009
Sold by
Residential Funding Co Llc
Bought by
Carlson Daniel S and Carlson Catherine M
Purchase Details
Closed on
Aug 3, 2007
Sold by
Gonzalez Ruben
Bought by
Olivares Marta and Olivares Adrian
Purchase Details
Closed on
Dec 20, 2006
Sold by
Wells Fargo Bank Na
Bought by
Gonzalez Ruben
Purchase Details
Closed on
Sep 27, 2002
Sold by
Encalada Jose and Encalada Elvia
Bought by
Hallberg Arden Wes
Purchase Details
Closed on
Jun 14, 2001
Sold by
Stclair Lavonne L
Bought by
Encalada Jose and Encalada Elvia
Purchase Details
Closed on
Jan 12, 1999
Sold by
Roskosh Andrew and Roskosh Irene H
Bought by
St Clair Lavonne L
Create a Home Valuation Report for This Property
The Home Valuation Report is an in-depth analysis detailing your home's value as well as a comparison with similar homes in the area
Home Values in the Area
Average Home Value in this Area
Purchase History
| Date | Buyer | Sale Price | Title Company |
|---|---|---|---|
| 1019 21St Street East Llc | -- | None Available | |
| 1019 21St Street East Llc | -- | None Available | |
| Carlson Daniel S | $127,002 | -- | |
| Olivares Marta | $380,000 | -- | |
| Gonzalez Ruben | $210,000 | -- | |
| Hallberg Arden Wes | $355,000 | -- | |
| Encalada Jose | $165,000 | -- | |
| St Clair Lavonne L | $79,000 | -- |
Source: Public Records
Tax History
| Year | Tax Paid | Tax Assessment Tax Assessment Total Assessment is a certain percentage of the fair market value that is determined by local assessors to be the total taxable value of land and additions on the property. | Land | Improvement |
|---|---|---|---|---|
| 2024 | $1,469 | $395,000 | $69,900 | $325,100 |
| 2023 | $3,916 | $400,000 | $70,000 | $330,000 |
| 2022 | $4,672 | $5,000 | $900 | $4,100 |
| 2021 | $7,343 | $449,500 | $70,000 | $379,500 |
| 2020 | $8,111 | $449,500 | $64,500 | $385,000 |
| 2019 | $6,933 | $428,000 | $64,500 | $363,500 |
| 2018 | $5,740 | $382,000 | $42,000 | $340,000 |
| 2017 | $5,484 | $287,000 | $38,200 | $248,800 |
| 2016 | $5,777 | $287,000 | $38,200 | $248,800 |
| 2015 | $5,081 | $239,000 | $38,200 | $200,800 |
| 2014 | -- | $208,000 | $42,400 | $165,600 |
Source: Public Records
Map
Nearby Homes
- 2211 10th Ave S
- 2206 Elliot Ave
- 1911 Elliot Ave
- 2100 14th Ave S
- 1903 Elliot Ave
- 2428 11th Ave S
- 1807 Elliot Ave Unit 4
- 1811 Elliot Ave Unit 2
- 1801 Elliot Ave Unit 5
- 1828 15th Ave S
- 1912 Columbus Ave
- 2508 11th Ave S
- 2221 Bloomington Ave
- 1829 Park Ave Unit 7
- 2433 Columbus Ct
- 2535 11th Ave S
- 628 E Franklin Ave Unit 301
- 2402 16th Ave S
- 1520 Elliot Ave Unit 4
- 2433 16th Ave S
- 1023 E 21st St
- 1017 E 21st St
- 2116 11th Ave S
- 1014 E 22nd St
- 2018 11th Ave S
- 2105 10th Ave S
- 2101 10th Ave S
- 2109 10th Ave S
- 2122 11th Ave S
- 1018 E 21st St
- 2101 11th Ave S
- 2113 10th Ave S
- 1012 E 21st St
- 1008 E 22nd St
- 2111 11th Ave S
- 1010 E 21st St
- 2113 11th Ave S
- 2119 10th Ave S
- 1006 E 21st St
- 2121 11th Ave S
Your Personal Tour Guide
Ask me questions while you tour the home.