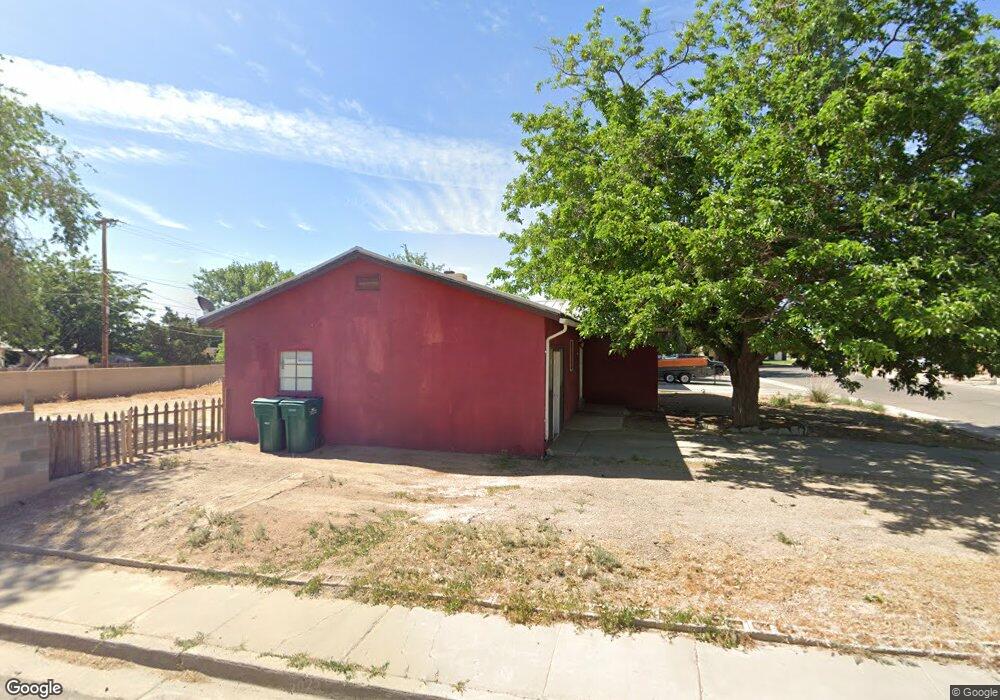
1019 E 26th St Farmington, NM 87401
Estimated Value: $211,000 - $261,000
--
Bed
--
Bath
1,214
Sq Ft
$193/Sq Ft
Est. Value
About This Home
This home is located at 1019 E 26th St, Farmington, NM 87401 and is currently estimated at $234,074, approximately $192 per square foot. 1019 E 26th St is a home located in San Juan County with nearby schools including Northeast Elementary School, Hermosa Middle School, and Farmington High School.
Ownership History
Date
Name
Owned For
Owner Type
Purchase Details
Closed on
Sep 7, 2022
Sold by
Ronald Callenius Living Trust
Bought by
Clark Scott A
Current Estimated Value
Home Financials for this Owner
Home Financials are based on the most recent Mortgage that was taken out on this home.
Original Mortgage
$157,102
Outstanding Balance
$150,152
Interest Rate
5.3%
Mortgage Type
FHA
Estimated Equity
$83,922
Purchase Details
Closed on
Aug 21, 2013
Sold by
Callenius Ronald W
Bought by
Callenius Ronald and Ronald Callenius Living Trust
Home Financials for this Owner
Home Financials are based on the most recent Mortgage that was taken out on this home.
Original Mortgage
$91,000
Interest Rate
4.53%
Mortgage Type
New Conventional
Purchase Details
Closed on
Oct 26, 2011
Sold by
Callenius Ronald
Bought by
Callenius Ronald and Ronald Callenius Living Trust
Purchase Details
Closed on
Sep 22, 2009
Sold by
Cullander Nicholas
Bought by
Jpmorgan Chase Bank Na
Create a Home Valuation Report for This Property
The Home Valuation Report is an in-depth analysis detailing your home's value as well as a comparison with similar homes in the area
Home Values in the Area
Average Home Value in this Area
Purchase History
| Date | Buyer | Sale Price | Title Company |
|---|---|---|---|
| Clark Scott A | $158,673 | None Listed On Document | |
| Callenius Ronald | -- | None Available | |
| Callenius Ronald W | -- | None Available | |
| Callenius Ronald | -- | None Available | |
| Jpmorgan Chase Bank Na | $110,500 | None Available |
Source: Public Records
Mortgage History
| Date | Status | Borrower | Loan Amount |
|---|---|---|---|
| Open | Clark Scott A | $157,102 | |
| Previous Owner | Callenius Ronald W | $91,000 |
Source: Public Records
Tax History Compared to Growth
Tax History
| Year | Tax Paid | Tax Assessment Tax Assessment Total Assessment is a certain percentage of the fair market value that is determined by local assessors to be the total taxable value of land and additions on the property. | Land | Improvement |
|---|---|---|---|---|
| 2024 | $1,271 | $53,460 | $0 | $0 |
| 2023 | $1,271 | $51,903 | $0 | $0 |
| 2022 | $1,087 | $45,234 | $0 | $0 |
| 2021 | $1,058 | $44,352 | $0 | $0 |
| 2020 | $1,049 | $44,110 | $0 | $0 |
| 2019 | $1,042 | $44,049 | $0 | $0 |
| 2018 | $1,000 | $43,002 | $0 | $0 |
| 2017 | $986 | $43,002 | $0 | $0 |
| 2016 | $982 | $43,002 | $0 | $0 |
| 2015 | $965 | $43,002 | $0 | $0 |
| 2014 | $1,046 | $46,208 | $0 | $0 |
Source: Public Records
Map
Nearby Homes
- 2602 Highland Place
- 1451 E 30th St
- XXX N Butler Ave
- 4951 N Butler Ave
- 2105 N Cochiti Ave
- 3204 N Mesa Verde Ave
- 2100 N Cochiti Ave
- 2305 Sage Dr
- 3306 N Cochiti Ave
- 3408 Northridge Ct
- 711 E 30th St
- 1702 N Carlton Ave
- 1722 E 21st St
- 3505 San Medina Ave
- 1520 Zuni Dr
- 3810 N Butler Ave
- 1604 N Cochiti Ave
- 1605 N Cochiti Ave
- 605 E 37th St
- NYA E 30th St
- 1017 E 26th St
- 1102 E 27th St
- 1100 E 27th St
- 1015 E 26th St
- 2601 Highland Place
- 1010 E 27th St
- 1200 E 27th St
- 1009 E 27th St
- 1008 E 27th St
- 1202 E 27th St
- 1010 E 26th St
- 1007 E 27th St
- 2603 Highland Place
- 1013 E 26th St
- 1011 E 26th St
- 1008 E 26th St
- 1006 E 27th St
- 2604 Highland Place
- 2611 Highland Place
- 1204 E 27th St