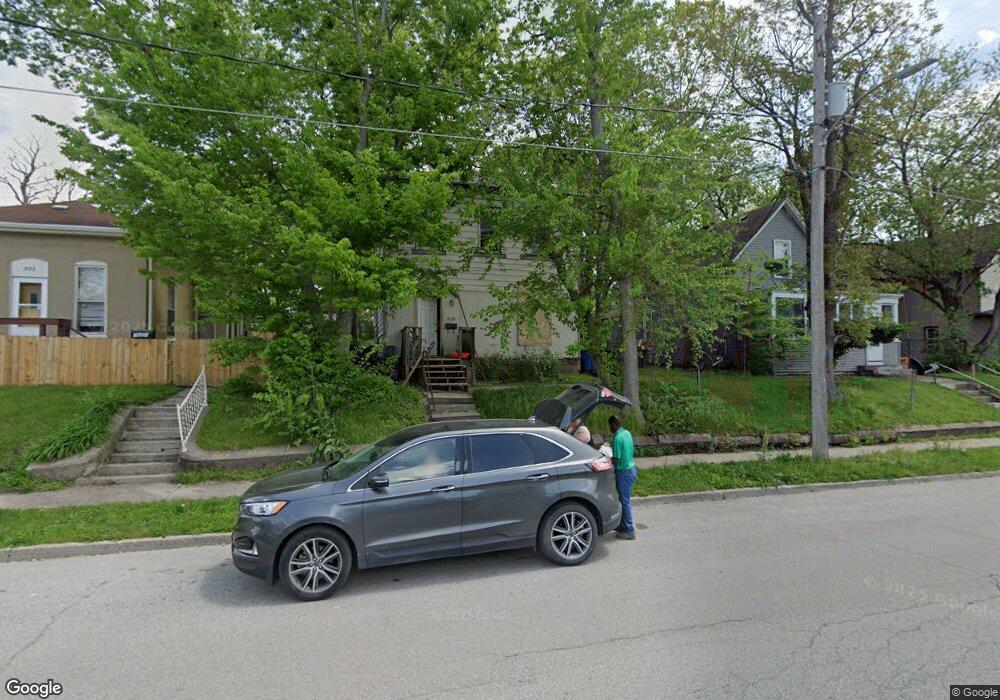
1019 E 9th St Des Moines, IA 50316
Capitol Park NeighborhoodEstimated Value: $104,786 - $114,000
3
Beds
2
Baths
1,250
Sq Ft
$88/Sq Ft
Est. Value
About This Home
This home is located at 1019 E 9th St, Des Moines, IA 50316 and is currently estimated at $109,393, approximately $87 per square foot. 1019 E 9th St is a home located in Polk County with nearby schools including Carver Elementary School, Hiatt Middle School, and East High School.
Ownership History
Date
Name
Owned For
Owner Type
Purchase Details
Closed on
Feb 17, 2017
Sold by
Reed Betty
Bought by
Cross Tonya
Current Estimated Value
Purchase Details
Closed on
Jun 6, 2012
Sold by
Cross Tonya Lynette
Bought by
Reed Betty L
Purchase Details
Closed on
Jun 30, 2008
Sold by
Reed Betty L
Bought by
Cross Tonya Lynette
Home Financials for this Owner
Home Financials are based on the most recent Mortgage that was taken out on this home.
Original Mortgage
$24,000
Interest Rate
6.05%
Mortgage Type
Seller Take Back
Purchase Details
Closed on
Dec 31, 1997
Sold by
Cross Geri
Bought by
Reed Betty L
Create a Home Valuation Report for This Property
The Home Valuation Report is an in-depth analysis detailing your home's value as well as a comparison with similar homes in the area
Home Values in the Area
Average Home Value in this Area
Purchase History
| Date | Buyer | Sale Price | Title Company |
|---|---|---|---|
| Cross Tonya | $55,000 | None Available | |
| Reed Betty L | -- | None Available | |
| Cross Tonya Lynette | $25,000 | None Available | |
| Reed Betty L | -- | -- |
Source: Public Records
Mortgage History
| Date | Status | Borrower | Loan Amount |
|---|---|---|---|
| Previous Owner | Cross Tonya Lynette | $24,000 |
Source: Public Records
Tax History
| Year | Tax Paid | Tax Assessment Tax Assessment Total Assessment is a certain percentage of the fair market value that is determined by local assessors to be the total taxable value of land and additions on the property. | Land | Improvement |
|---|---|---|---|---|
| 2025 | $1,608 | $107,000 | $17,500 | $89,500 |
| 2024 | $1,608 | $92,200 | $15,000 | $77,200 |
| 2023 | $1,462 | $92,200 | $15,000 | $77,200 |
| 2022 | $1,448 | $70,900 | $12,000 | $58,900 |
| 2021 | $1,332 | $70,900 | $12,000 | $58,900 |
| 2020 | $1,380 | $62,000 | $10,600 | $51,400 |
| 2019 | $1,356 | $62,000 | $10,600 | $51,400 |
| 2018 | $1,220 | $59,000 | $9,900 | $49,100 |
| 2017 | $1,510 | $59,000 | $9,900 | $49,100 |
| 2016 | $1,470 | $55,800 | $9,300 | $46,500 |
| 2015 | $1,470 | $55,800 | $9,300 | $46,500 |
| 2014 | $1,773 | $59,300 | $9,900 | $49,400 |
Source: Public Records
Map
Nearby Homes
- 918 Buchanan St
- 1018 E 12th St
- 1019 E 8th St
- 917 E 12th St
- 812 Lyon St
- 813 Lyon St
- 1349 E 12th St
- 1350 E 9th St
- 1352 E 12th St
- 1372 E 12th St
- 906 Cleveland Ave
- 225 Maple St
- 221 Maple St
- 213 Maple St
- 45 Grays Station Plat 4 Pkwy
- 46 Grays Station Plat 4 Pkwy
- 44 Grays Station Plat 4 Pkwy
- 205 Maple St
- 857 E 2nd St
- 859 E 2nd St
Your Personal Tour Guide
Ask me questions while you tour the home.