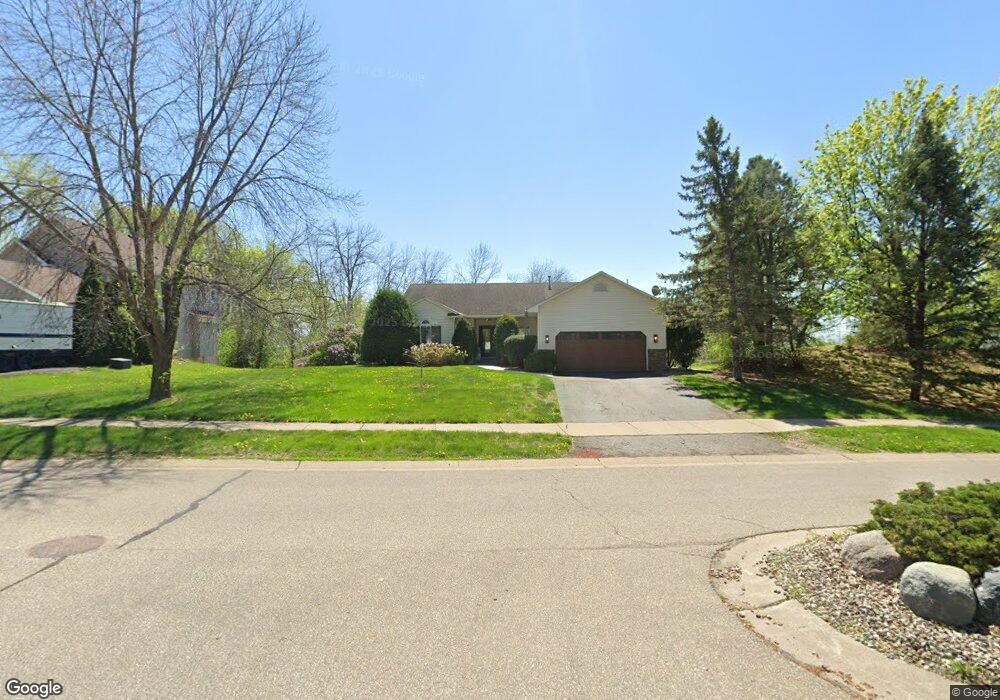
1019 Falls Curve Chaska, MN 55318
Estimated Value: $484,516 - $502,000
4
Beds
3
Baths
1,473
Sq Ft
$335/Sq Ft
Est. Value
About This Home
This home is located at 1019 Falls Curve, Chaska, MN 55318 and is currently estimated at $492,879, approximately $334 per square foot. 1019 Falls Curve is a home located in Carver County with nearby schools including Clover Ridge Elementary School, Chaska Middle School West, and Chaska High School.
Ownership History
Date
Name
Owned For
Owner Type
Purchase Details
Closed on
Feb 12, 2024
Sold by
Gowan Gregory J and Gowan Jillyne M
Bought by
Gregory J Gowan Revocable Trust and Jillyne M Gowan Revocable Trust
Current Estimated Value
Purchase Details
Closed on
Feb 3, 2023
Sold by
Gowan Greogry J and Gowan Jillyne M
Bought by
Gowan Gregory J and Gowan Jillyne M
Purchase Details
Closed on
Jan 30, 2008
Sold by
Jacoby William and Brown Jacoby Ruth J
Bought by
Gowan Gregory J
Home Financials for this Owner
Home Financials are based on the most recent Mortgage that was taken out on this home.
Original Mortgage
$200,000
Interest Rate
6.11%
Mortgage Type
New Conventional
Purchase Details
Closed on
Dec 11, 2003
Sold by
Robbins William E
Bought by
Jacoby William Y
Purchase Details
Closed on
Jun 26, 2001
Sold by
Beckey Stephen P and Beckey Sherry M
Bought by
Robbins William E and Robbins Eunice J
Purchase Details
Closed on
Nov 28, 1997
Sold by
Ulman Kirk J and Ulman Marina
Bought by
Beckey Sherry M and Beckey Stephen P
Create a Home Valuation Report for This Property
The Home Valuation Report is an in-depth analysis detailing your home's value as well as a comparison with similar homes in the area
Home Values in the Area
Average Home Value in this Area
Purchase History
| Date | Buyer | Sale Price | Title Company |
|---|---|---|---|
| Gregory J Gowan Revocable Trust | $500 | None Listed On Document | |
| Gowan Gregory J | $500 | -- | |
| Gowan Gregory J | $302,900 | -- | |
| Jacoby William Y | $255,000 | -- | |
| Robbins William E | $255,000 | -- | |
| Beckey Sherry M | $186,500 | -- |
Source: Public Records
Mortgage History
| Date | Status | Borrower | Loan Amount |
|---|---|---|---|
| Previous Owner | Gowan Gregory J | $200,000 |
Source: Public Records
Tax History
| Year | Tax Paid | Tax Assessment Tax Assessment Total Assessment is a certain percentage of the fair market value that is determined by local assessors to be the total taxable value of land and additions on the property. | Land | Improvement |
|---|---|---|---|---|
| 2025 | $4,932 | $440,100 | $130,000 | $310,100 |
| 2024 | $4,830 | $418,000 | $130,000 | $288,000 |
| 2023 | $4,468 | $411,700 | $130,000 | $281,700 |
| 2022 | $4,200 | $399,200 | $117,800 | $281,400 |
| 2021 | $3,886 | $327,800 | $98,200 | $229,600 |
| 2020 | $3,918 | $327,800 | $98,200 | $229,600 |
| 2019 | $3,812 | $306,100 | $93,500 | $212,600 |
| 2018 | $3,706 | $306,100 | $93,500 | $212,600 |
| 2017 | $3,884 | $295,600 | $85,000 | $210,600 |
| 2016 | $3,930 | $283,500 | $0 | $0 |
| 2015 | $3,214 | $260,000 | $0 | $0 |
| 2014 | $3,214 | $220,700 | $0 | $0 |
Source: Public Records
Map
Nearby Homes
- 821 Howard Ln
- 1242 Crystal Place E
- 1427 Ravoux Ln
- 2338 Manuela Dr
- 4848 Engler Blvd
- 388 Brickyard Dr
- 952 Conner St
- 867 Oriole Ln
- 954 Conner St
- 332 Brickyard Dr
- 1340 Broadview Ave
- 2890 Autumn Woods Dr
- 225 Cardinal Ln
- 2888 Forest Ridge
- 312 Wagon Wheel Ln Unit 16
- 2906 Butternut Dr
- 1840 Freedom Ln Unit 104
- 3031 Sugar Maple Dr
- 9580 Madison Dr Unit 4
- 9620 Washington Blvd Unit 1
- 1025 Falls Curve
- 1031 Falls Curve
- 1020 Falls Curve
- 1026 Falls Curve
- 1037 Falls Curve
- 1032 Falls Curve
- 1038 Falls Curve
- 1043 Falls Curve
- 1940 Wenz Ave
- 898 Howard Ln
- 1044 Falls Curve
- 1049 Falls Curve
- 1950 Wenz Ave
- 1930 Wenz Ave
- 1908 Mabel Ct
- 1050 Falls Curve
- 1920 Wenz Ave
- 1960 Wenz Ave
- 876 Howard Ln
- 1905 Mabel Ct
Your Personal Tour Guide
Ask me questions while you tour the home.