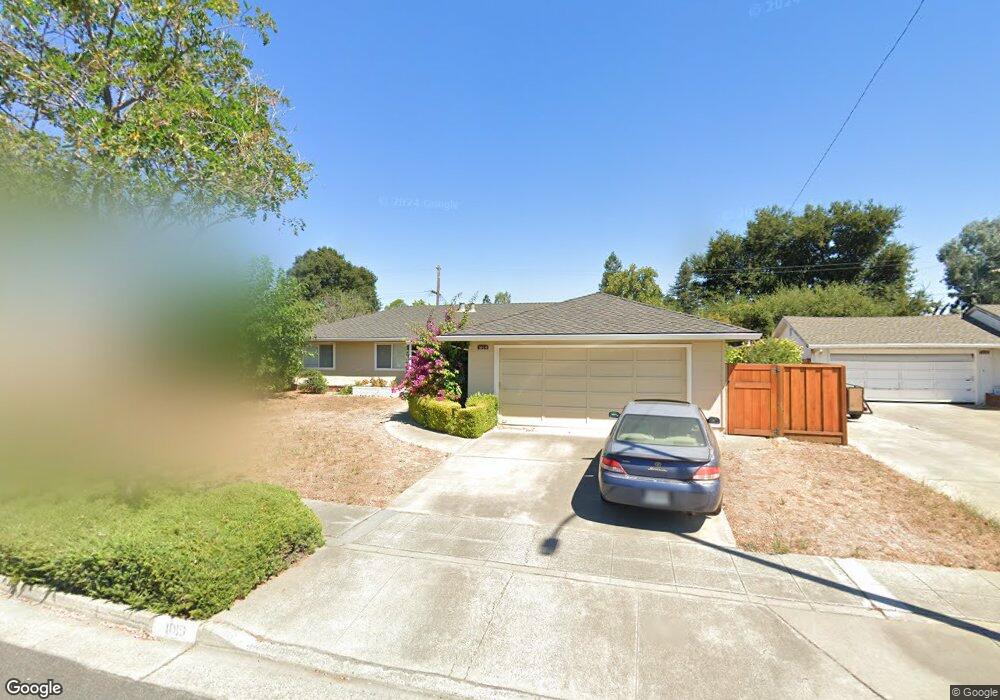
1019 Havre Ct Sunnyvale, CA 94087
Estimated Value: $3,255,000 - $3,466,000
4
Beds
2
Baths
1,889
Sq Ft
$1,759/Sq Ft
Est. Value
About This Home
This home is located at 1019 Havre Ct, Sunnyvale, CA 94087 and is currently estimated at $3,322,607, approximately $1,758 per square foot. 1019 Havre Ct is a home located in Santa Clara County with nearby schools including West Valley Elementary School, Cupertino Middle School, and Homestead High School.
Ownership History
Date
Name
Owned For
Owner Type
Purchase Details
Closed on
Oct 17, 2022
Sold by
Hui Dennis
Bought by
Galatians 2 20 Trust and Hui
Current Estimated Value
Purchase Details
Closed on
Nov 19, 2012
Sold by
Hui Dennis and Yau Hoi Ying Linda
Bought by
Hui Dennis and Yau Hoi Ying Linda
Home Financials for this Owner
Home Financials are based on the most recent Mortgage that was taken out on this home.
Original Mortgage
$620,000
Interest Rate
3.33%
Mortgage Type
New Conventional
Purchase Details
Closed on
Sep 10, 2010
Sold by
Dotson Linda Pearl
Bought by
Hui Dennis and Yau Hoi Ying Linda
Home Financials for this Owner
Home Financials are based on the most recent Mortgage that was taken out on this home.
Original Mortgage
$155,000
Interest Rate
4.35%
Mortgage Type
Unknown
Purchase Details
Closed on
Aug 7, 2009
Sold by
Dotson Alvin and Dotson Pearl S
Bought by
Dotson Alvin and Dotson Pearl S
Create a Home Valuation Report for This Property
The Home Valuation Report is an in-depth analysis detailing your home's value as well as a comparison with similar homes in the area
Home Values in the Area
Average Home Value in this Area
Purchase History
| Date | Buyer | Sale Price | Title Company |
|---|---|---|---|
| Galatians 2 20 Trust | -- | None Listed On Document | |
| Hui Dennis | -- | Chicago Title Company | |
| Hui Dennis | $1,080,000 | First American Title Company | |
| Dotson Alvin | -- | None Available |
Source: Public Records
Mortgage History
| Date | Status | Borrower | Loan Amount |
|---|---|---|---|
| Previous Owner | Hui Dennis | $620,000 | |
| Previous Owner | Hui Dennis | $155,000 | |
| Previous Owner | Hui Dennis | $648,000 |
Source: Public Records
Tax History Compared to Growth
Tax History
| Year | Tax Paid | Tax Assessment Tax Assessment Total Assessment is a certain percentage of the fair market value that is determined by local assessors to be the total taxable value of land and additions on the property. | Land | Improvement |
|---|---|---|---|---|
| 2025 | $15,785 | $1,383,659 | $1,106,930 | $276,729 |
| 2024 | $15,785 | $1,356,529 | $1,085,226 | $271,303 |
| 2023 | $15,706 | $1,329,932 | $1,063,948 | $265,984 |
| 2022 | $15,680 | $1,303,856 | $1,043,087 | $260,769 |
| 2021 | $15,545 | $1,278,291 | $1,022,635 | $255,656 |
| 2020 | $15,368 | $1,265,185 | $1,012,150 | $253,035 |
| 2019 | $15,028 | $1,240,378 | $992,304 | $248,074 |
| 2018 | $14,682 | $1,216,058 | $972,848 | $243,210 |
| 2017 | $14,611 | $1,192,215 | $953,773 | $238,442 |
| 2016 | $14,194 | $1,168,839 | $935,072 | $233,767 |
| 2015 | $14,113 | $1,151,283 | $921,027 | $230,256 |
| 2014 | $13,766 | $1,128,732 | $902,986 | $225,746 |
Source: Public Records
Map
Nearby Homes
- 1507 Dominion Ave
- 1014 W Homestead Rd
- 1523 Ashcroft Way
- 1402 Bedford Ave
- 1768 Karameos Ct
- 10881 Barranca Dr
- 1901 Alford Ave
- 1881 Alford Ave
- 974 Pocatello Ave
- 22330 Homestead Rd Unit 307
- 22081 Caroline Dr
- 1244 Elderberry Dr
- 1624 Clay Dr
- 10715 Grapnel Place
- 1243 E Fremont Terrace
- 1072 Syracuse Dr
- 10683 Pebble Place
- 1684 Newcastle Dr
- 1590 Vineyard Dr
- 5349 Beechwood Ln
- 1015 Havre Ct
- 1023 Havre Ct
- 1038 Eugene Ct
- 1044 Eugene Ct
- 1025 Havre Ct
- 1011 Havre Ct
- 1024 Havre Ct
- 1020 Havre Ct
- 1037 Eugene Ct
- 1029 Havre Ct
- 1028 Edmonds Ct
- 1050 Eugene Ct
- 1007 Havre Ct
- 1020 Edmonds Ct
- 1550 Dominion Ave
- 1556 Dominion Ave
- 1562 Dominion Ave
- 1043 Eugene Ct
- 1568 Dominion Ave
- 1033 Havre Ct