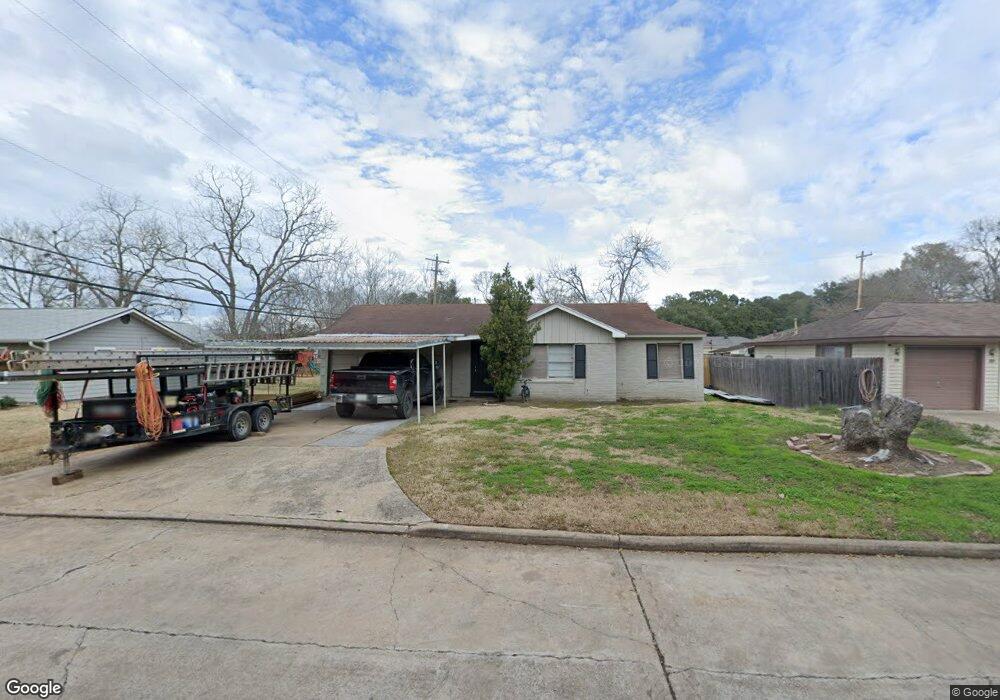
1019 Lindsey Dr Rosenberg, TX 77471
Estimated Value: $207,320 - $250,000
3
Beds
2
Baths
1,554
Sq Ft
$148/Sq Ft
Est. Value
About This Home
This home is located at 1019 Lindsey Dr, Rosenberg, TX 77471 and is currently estimated at $230,580, approximately $148 per square foot. 1019 Lindsey Dr is a home located in Fort Bend County with nearby schools including Smith Elementary School, J J Wessendorff Middle School, and Lamar Junior High School.
Ownership History
Date
Name
Owned For
Owner Type
Purchase Details
Closed on
Oct 25, 2016
Sold by
Synergy Real Estate Group Llc
Bought by
Menjivar Carlos B and Menjivar Silvia E
Current Estimated Value
Purchase Details
Closed on
Nov 2, 2012
Sold by
Mize Jack Alleo
Bought by
Synergy Real Estate Group Llc
Home Financials for this Owner
Home Financials are based on the most recent Mortgage that was taken out on this home.
Original Mortgage
$65,000
Interest Rate
3.52%
Mortgage Type
Purchase Money Mortgage
Purchase Details
Closed on
Aug 3, 2008
Sold by
Jmx2 Properties Llc
Bought by
Mize Jack Allen
Purchase Details
Closed on
Sep 7, 2007
Sold by
Wilson Mary M and Wilson Thomas A
Bought by
Virtual Real Estate Marketing Llc
Home Financials for this Owner
Home Financials are based on the most recent Mortgage that was taken out on this home.
Original Mortgage
$66,500
Interest Rate
6.63%
Mortgage Type
Purchase Money Mortgage
Create a Home Valuation Report for This Property
The Home Valuation Report is an in-depth analysis detailing your home's value as well as a comparison with similar homes in the area
Home Values in the Area
Average Home Value in this Area
Purchase History
| Date | Buyer | Sale Price | Title Company |
|---|---|---|---|
| Menjivar Carlos B | -- | Stewart Title | |
| Synergy Real Estate Group Llc | -- | None Available | |
| Mize Jack Allen | -- | None Available | |
| Menjivar Carlos B | -- | -- | |
| Virtual Real Estate Marketing Llc | -- | First American Title |
Source: Public Records
Mortgage History
| Date | Status | Borrower | Loan Amount |
|---|---|---|---|
| Previous Owner | Synergy Real Estate Group Llc | $65,000 | |
| Previous Owner | Virtual Real Estate Marketing Llc | $66,500 |
Source: Public Records
Tax History Compared to Growth
Tax History
| Year | Tax Paid | Tax Assessment Tax Assessment Total Assessment is a certain percentage of the fair market value that is determined by local assessors to be the total taxable value of land and additions on the property. | Land | Improvement |
|---|---|---|---|---|
| 2025 | $3,722 | $135,161 | $10,985 | $124,176 |
| 2024 | $3,722 | $197,047 | $10,985 | $186,062 |
| 2023 | $4,344 | $225,024 | $10,608 | $214,416 |
| 2022 | $3,210 | $156,700 | $10,610 | $146,090 |
| 2021 | $2,860 | $137,840 | $10,610 | $127,230 |
| 2020 | $2,892 | $136,270 | $10,610 | $125,660 |
| 2019 | $3,108 | $136,090 | $10,610 | $125,480 |
| 2018 | $2,562 | $110,370 | $10,610 | $99,760 |
| 2017 | $2,529 | $108,350 | $10,610 | $97,740 |
| 2016 | $2,413 | $103,390 | $10,610 | $92,780 |
| 2015 | $1,762 | $75,090 | $10,610 | $64,480 |
| 2014 | $1,526 | $64,260 | $10,610 | $53,650 |
Source: Public Records
Map
Nearby Homes
- 1109 Frances Dr
- 4602 Avenue H
- 1806 Cedar Dr
- 1809 Hawthorn Dr
- 1805 Hawthorn Dr
- 5002 Quebec Blvd
- 5027 Quebec Blvd
- 5303 Rivers Edge Dr
- 5319 Rivers Edge Dr
- 4502 River Rd
- 5121 Alderney Ct
- 1504 Radio Ln
- 4707 E Parma Dr
- 1922 Teakwood St
- 5106 Alderney Ct
- 512 and 514 Travis St
- 1004 Country Club Dr
- 1230 Law Ct
- 6219 Deep Gulch Dr
- 6215 Deep Gulch Dr
- 1021 Lindsey Dr
- 1017 Lindsey Dr
- 1014 Frances Dr
- 1023 Lindsey Dr
- 1016 Frances Dr
- 1012 Frances Dr
- 1013 Lindsey Dr
- 1010 Frances Dr
- 1018 Frances Dr
- 1020 Lindsey Dr
- 1018 Lindsey Dr
- 1025 Lindsey Dr
- 1024 Lindsey Dr
- 1008 Frances Dr
- 1016 Lindsey Dr
- 1020 Frances Dr
- 1011 Lindsey Dr
- 1026 Lindsey Dr
- 1012 Lindsey Dr
- 1029 Lindsey Dr