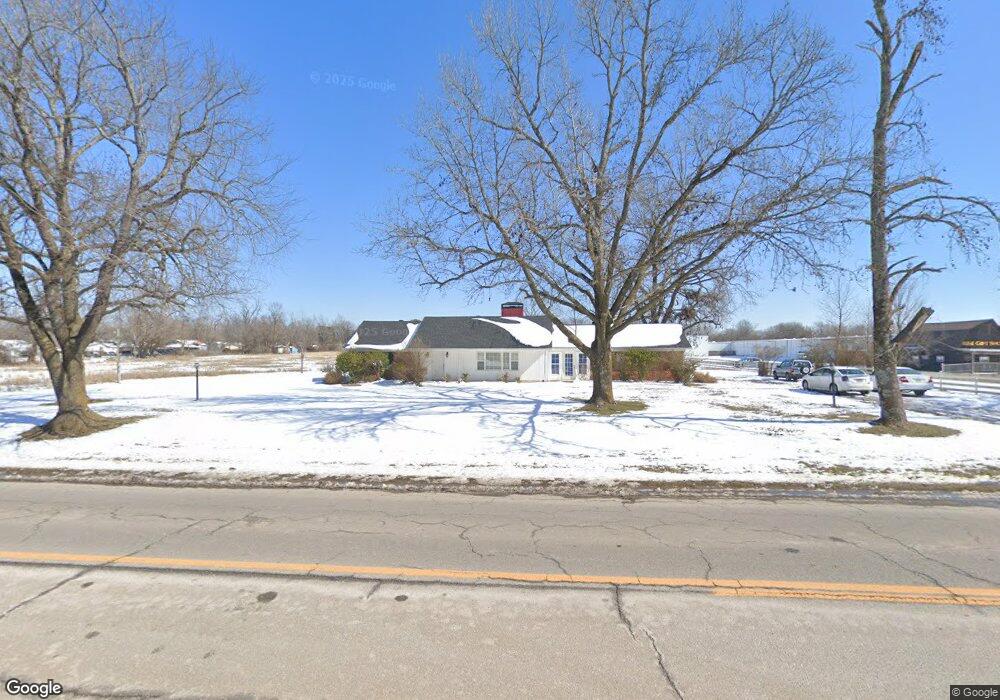
1019 N 2nd St Rogers, AR 72756
Estimated Value: $311,000 - $1,176,066
--
Bed
1
Bath
1,468
Sq Ft
$506/Sq Ft
Est. Value
About This Home
This home is located at 1019 N 2nd St, Rogers, AR 72756 and is currently estimated at $743,533, approximately $506 per square foot. 1019 N 2nd St is a home located in Benton County with nearby schools including Northside Elementary School, Lingle Middle School, and Rogers Heritage High School.
Ownership History
Date
Name
Owned For
Owner Type
Purchase Details
Closed on
Jun 27, 2018
Sold by
Webster Dale and Webster Carolyn Jane
Bought by
Dms General Partnership
Current Estimated Value
Home Financials for this Owner
Home Financials are based on the most recent Mortgage that was taken out on this home.
Original Mortgage
$453,400
Interest Rate
4.6%
Mortgage Type
Purchase Money Mortgage
Purchase Details
Closed on
Oct 1, 2001
Bought by
Webster Tr
Purchase Details
Closed on
Dec 9, 1993
Bought by
Hse Webster
Purchase Details
Closed on
Jul 27, 1972
Bought by
Webster
Purchase Details
Closed on
Jul 2, 1971
Bought by
Webster
Purchase Details
Closed on
Apr 9, 1962
Bought by
Webster
Purchase Details
Closed on
Feb 25, 1946
Bought by
Webster
Create a Home Valuation Report for This Property
The Home Valuation Report is an in-depth analysis detailing your home's value as well as a comparison with similar homes in the area
Home Values in the Area
Average Home Value in this Area
Purchase History
| Date | Buyer | Sale Price | Title Company |
|---|---|---|---|
| Dms General Partnership | $567,010 | Waco Title Company | |
| Webster Tr | -- | -- | |
| Hse Webster | -- | -- | |
| Webster | -- | -- | |
| Webster | -- | -- | |
| Webster | -- | -- | |
| Webster | -- | -- |
Source: Public Records
Mortgage History
| Date | Status | Borrower | Loan Amount |
|---|---|---|---|
| Closed | Dms General Partnership | $453,400 |
Source: Public Records
Tax History Compared to Growth
Tax History
| Year | Tax Paid | Tax Assessment Tax Assessment Total Assessment is a certain percentage of the fair market value that is determined by local assessors to be the total taxable value of land and additions on the property. | Land | Improvement |
|---|---|---|---|---|
| 2025 | -- | -- | -- | -- |
| 2024 | -- | $0 | $0 | $0 |
| 2023 | $0 | $0 | $0 | $0 |
| 2022 | $1,783 | $0 | $0 | $0 |
| 2021 | $1,783 | $0 | $0 | $0 |
| 2020 | $1,783 | $0 | $0 | $0 |
| 2019 | $1,783 | $32,480 | $12,720 | $19,760 |
| 2018 | $1,783 | $32,480 | $12,720 | $19,760 |
| 2017 | $1,722 | $32,480 | $12,720 | $19,760 |
| 2016 | $1,479 | $32,480 | $12,720 | $19,760 |
| 2015 | $1,370 | $25,900 | $12,250 | $13,650 |
| 2014 | $1,370 | $25,900 | $12,250 | $13,650 |
Source: Public Records
Map
Nearby Homes