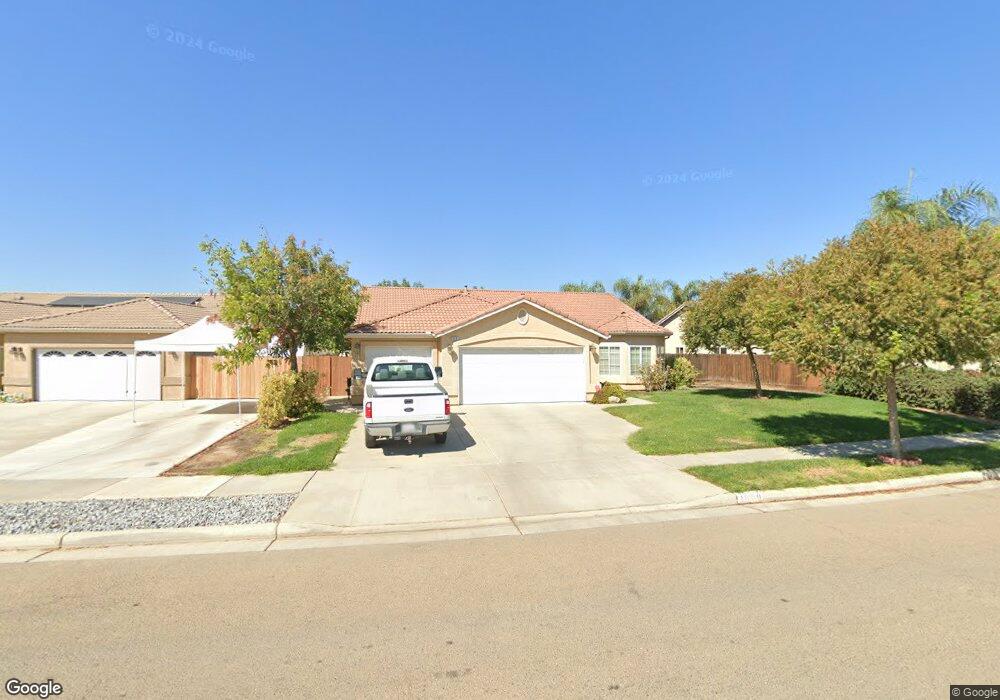
1019 Par Ave Lemoore, CA 93245
Estimated Value: $419,132 - $452,000
3
Beds
2
Baths
2,097
Sq Ft
$208/Sq Ft
Est. Value
About This Home
This home is located at 1019 Par Ave, Lemoore, CA 93245 and is currently estimated at $435,783, approximately $207 per square foot. 1019 Par Ave is a home located in Kings County with nearby schools including P.W. Engvall Elementary School, Liberty Middle School, and Lemoore High School.
Ownership History
Date
Name
Owned For
Owner Type
Purchase Details
Closed on
Sep 16, 2021
Sold by
Neyer Lorin Lee and Butler Family 1994 Rlt
Bought by
Simas Patrick M and Simas Teri M
Current Estimated Value
Purchase Details
Closed on
Feb 2, 2017
Sold by
Butler Beverly
Bought by
Neyer Lorin Lee and The Butler Family 1994 Revocab
Purchase Details
Closed on
Feb 1, 2017
Sold by
Richards Jonathan Lee
Bought by
Butler Beverly
Purchase Details
Closed on
Nov 18, 2015
Sold by
Butler Thomas and Butler Beverly
Bought by
Butler Thomas and Butler Beverly
Purchase Details
Closed on
Feb 10, 2010
Sold by
Butler Thomas and Butler Beverly
Bought by
Butler Thomas and Butler Beverly
Purchase Details
Closed on
Aug 5, 2005
Sold by
Fairway Homes
Bought by
Butler Thomas R and Butler Beverly J
Home Financials for this Owner
Home Financials are based on the most recent Mortgage that was taken out on this home.
Original Mortgage
$260,900
Interest Rate
5.61%
Mortgage Type
Fannie Mae Freddie Mac
Create a Home Valuation Report for This Property
The Home Valuation Report is an in-depth analysis detailing your home's value as well as a comparison with similar homes in the area
Home Values in the Area
Average Home Value in this Area
Purchase History
| Date | Buyer | Sale Price | Title Company |
|---|---|---|---|
| Simas Patrick M | $375,000 | Stewart Title Of Ca Inc | |
| Neyer Lorin Lee | -- | None Available | |
| Butler Beverly | -- | None Available | |
| Butler Thomas | -- | None Available | |
| Butler Thomas | -- | None Available | |
| Butler Thomas R | $335,000 | Chicago Title Company |
Source: Public Records
Mortgage History
| Date | Status | Borrower | Loan Amount |
|---|---|---|---|
| Previous Owner | Butler Thomas R | $260,900 |
Source: Public Records
Tax History
| Year | Tax Paid | Tax Assessment Tax Assessment Total Assessment is a certain percentage of the fair market value that is determined by local assessors to be the total taxable value of land and additions on the property. | Land | Improvement |
|---|---|---|---|---|
| 2025 | $4,185 | $397,952 | $79,590 | $318,362 |
| 2023 | $4,185 | $382,500 | $76,500 | $306,000 |
| 2022 | $4,376 | $375,000 | $75,000 | $300,000 |
| 2021 | $3,663 | $314,000 | $80,000 | $234,000 |
| 2020 | $3,379 | $295,000 | $75,000 | $220,000 |
| 2019 | $3,242 | $280,000 | $70,000 | $210,000 |
| 2018 | $2,981 | $268,000 | $70,000 | $198,000 |
| 2017 | $3,008 | $265,000 | $70,000 | $195,000 |
| 2016 | $2,694 | $247,800 | $70,000 | $177,800 |
| 2015 | $2,595 | $236,000 | $70,000 | $166,000 |
| 2014 | $2,369 | $217,231 | $60,272 | $156,959 |
Source: Public Records
Map
Nearby Homes
Your Personal Tour Guide
Ask me questions while you tour the home.