Estimated Value: $73,394 - $96,000
1
Bed
1
Bath
857
Sq Ft
$103/Sq Ft
Est. Value
About This Home
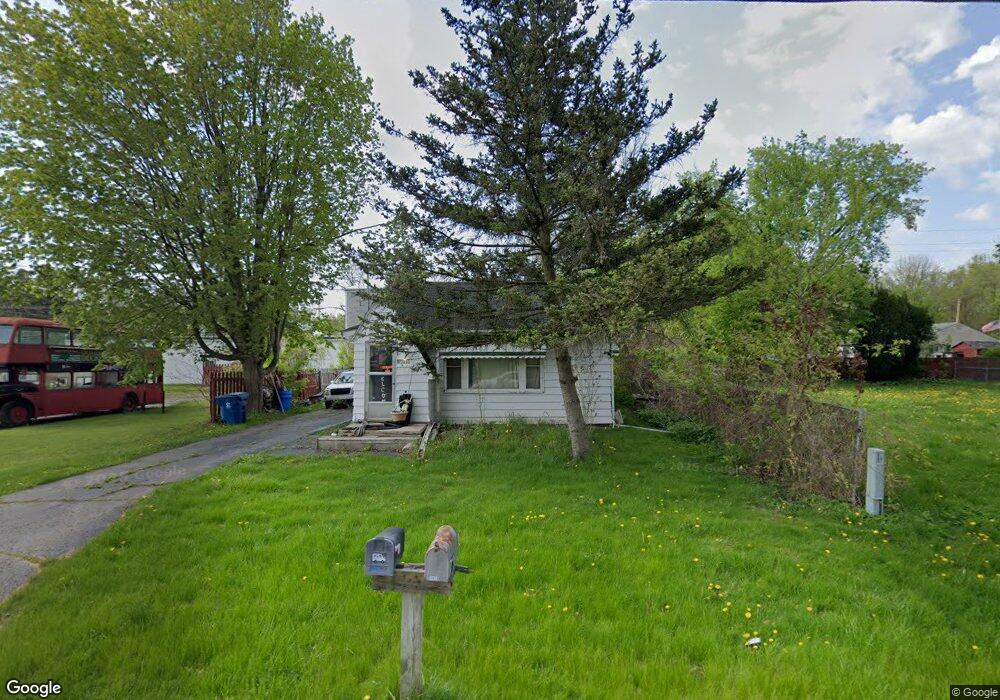
This home is located at 1019 W Williamson Ave, Flint, MI 48507 and is currently estimated at $88,599, approximately $103 per square foot. 1019 W Williamson Ave is a home located in Genesee County with nearby schools including Carman-Ainsworth High School.
Ownership History
Date
Name
Owned For
Owner Type
Purchase Details
Closed on
Sep 9, 2022
Sold by
Yarbrough Kenneth T and Yarbrough Nannette
Bought by
Yarbrough Nicole R
Current Estimated Value
Home Financials for this Owner
Home Financials are based on the most recent Mortgage that was taken out on this home.
Original Mortgage
$33,600
Outstanding Balance
$28,590
Interest Rate
4.59%
Mortgage Type
New Conventional
Estimated Equity
$60,009
Purchase Details
Closed on
Oct 8, 2021
Sold by
William Kilbreath Randy and William Diane M
Bought by
Yarbrough Kenneth J and Yarbrough Nannette
Purchase Details
Closed on
Jun 10, 2019
Sold by
Winegardner David Glen and Winegardner Elizabeth M
Bought by
Kilbreath Randy William and Kilbreath Diane M
Purchase Details
Closed on
Feb 21, 2006
Sold by
Kilbreath Randy William and Kilbreath Diane M
Bought by
Winegardner David Glen and Winegardner Elizabeth M
Purchase Details
Closed on
May 10, 2001
Sold by
Kilbreath Agatha J and Kilbreath Harold W
Bought by
Kilbreath Randy William
Create a Home Valuation Report for This Property
The Home Valuation Report is an in-depth analysis detailing your home's value as well as a comparison with similar homes in the area
Home Values in the Area
Average Home Value in this Area
Purchase History
| Date | Buyer | Sale Price | Title Company |
|---|---|---|---|
| Yarbrough Nicole R | -- | -- | |
| Yarbrough Kenneth J | $37,000 | Devon Title | |
| Kilbreath Randy William | -- | None Available | |
| Winegardner David Glen | -- | Multiple | |
| Kilbreath Randy William | -- | -- |
Source: Public Records
Mortgage History
| Date | Status | Borrower | Loan Amount |
|---|---|---|---|
| Open | Yarbrough Nicole R | $33,600 |
Source: Public Records
Tax History
| Year | Tax Paid | Tax Assessment Tax Assessment Total Assessment is a certain percentage of the fair market value that is determined by local assessors to be the total taxable value of land and additions on the property. | Land | Improvement |
|---|---|---|---|---|
| 2025 | $1,315 | $40,300 | $0 | $0 |
| 2024 | $635 | $35,700 | $0 | $0 |
| 2023 | $606 | $30,200 | $0 | $0 |
| 2022 | $616 | $25,700 | $0 | $0 |
| 2021 | $994 | $20,100 | $0 | $0 |
| 2020 | $783 | $16,900 | $0 | $0 |
| 2019 | $527 | $20,600 | $0 | $0 |
| 2018 | $1,107 | $17,200 | $0 | $0 |
| 2017 | $1,301 | $17,200 | $0 | $0 |
| 2016 | $1,099 | $15,700 | $0 | $0 |
| 2015 | $519 | $13,500 | $0 | $0 |
| 2014 | $308 | $13,000 | $0 | $0 |
| 2012 | -- | $20,800 | $20,800 | $0 |
Source: Public Records
Map
Nearby Homes
- 1051 W Mclean Ave
- 1111 Trotwood Ln
- 1111 W Mclean Ave
- 1097 W Buder Ave
- 1085 W Parkwood Ave
- 1034 W Bergin Ave
- 1119 W Bergin Ave
- 1203 Pickwick Place
- 1121 W Boatfield Ave
- VACANT Green Briar Blvd
- 1019 E Bristol Rd
- 4460 Bristolwood Dr
- 4444 Carmanwood Dr
- 4418 Ashlawn Dr
- 4139 Moulton Dr
- 1408 Williamsburg Rd
- 1256 W Rowland St
- 1376 Ready Ave
- 1489 Maria St
- V/L E Scottwood Ave
- 1029 W Williamson Ave
- 4242 Fenton Rd
- 1030 W Judd Rd
- 1018 W Williamson Ave
- 4226 Fenton Rd
- 1037 W Williamson Ave
- 1036 W Williamson Ave
- 1040 W Judd Rd
- 1019 W Schumacher Ave
- 1023 W Schumacher Ave Unit Bldg-Unit
- 1023 W Schumacher Ave
- 1045 W Williamson Ave
- 1040 W Williamson Ave
- 1029 W Schumacher Ave
- 4235 Fenton Rd
- 1037 W Schumacher Ave
- 4235 Fenton Rd
- 1041 W Schumacher Ave
- 1056 W Williamson Ave
- 1054 W Judd Rd
Your Personal Tour Guide
Ask me questions while you tour the home.