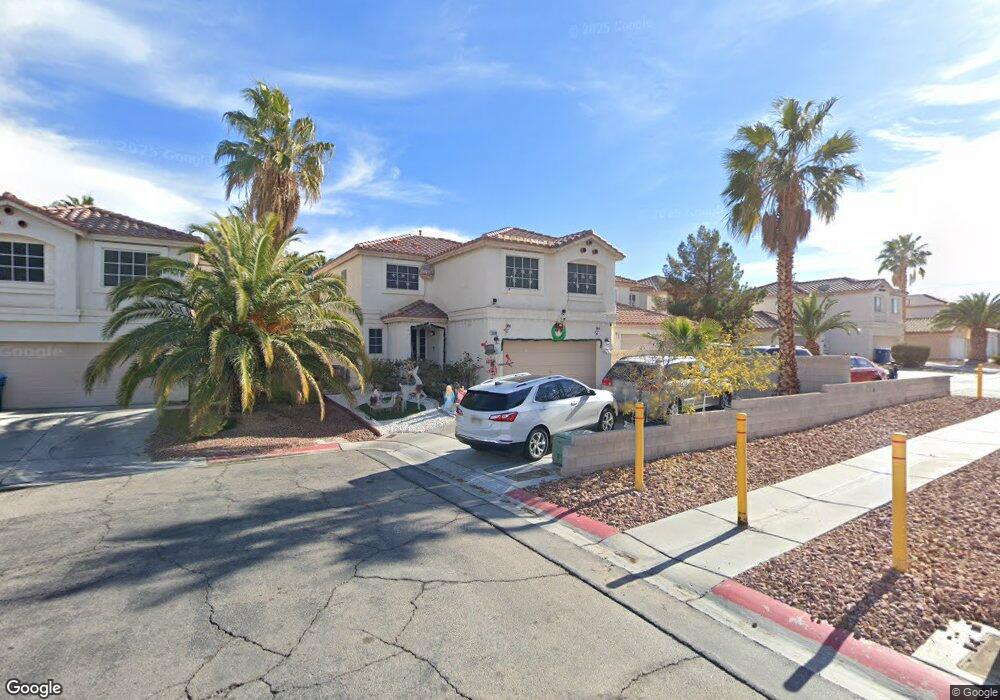
10190 Grape Ivy Ct Las Vegas, NV 89183
Silverado Ranch NeighborhoodEstimated Value: $425,953 - $452,000
4
Beds
3
Baths
1,741
Sq Ft
$255/Sq Ft
Est. Value
About This Home
This home is located at 10190 Grape Ivy Ct, Las Vegas, NV 89183 and is currently estimated at $443,988, approximately $255 per square foot. 10190 Grape Ivy Ct is a home located in Clark County with nearby schools including John C. Bass Elementary School, Charles Silvestri Junior High School, and Liberty High School.
Ownership History
Date
Name
Owned For
Owner Type
Purchase Details
Closed on
Sep 16, 2003
Sold by
Galiza Joanalyn L
Bought by
Galiza Arnold and Galiza Joanalyn L
Current Estimated Value
Home Financials for this Owner
Home Financials are based on the most recent Mortgage that was taken out on this home.
Original Mortgage
$150,800
Interest Rate
6.3%
Mortgage Type
Unknown
Purchase Details
Closed on
Mar 28, 2001
Sold by
Galiza Arnold V
Bought by
Galiza Joanalyn Lagat
Home Financials for this Owner
Home Financials are based on the most recent Mortgage that was taken out on this home.
Original Mortgage
$148,100
Interest Rate
7.06%
Purchase Details
Closed on
Feb 12, 2001
Sold by
American West Homes Inc
Bought by
Galiza Joanalyn L
Home Financials for this Owner
Home Financials are based on the most recent Mortgage that was taken out on this home.
Original Mortgage
$148,100
Interest Rate
7.06%
Create a Home Valuation Report for This Property
The Home Valuation Report is an in-depth analysis detailing your home's value as well as a comparison with similar homes in the area
Home Values in the Area
Average Home Value in this Area
Purchase History
| Date | Buyer | Sale Price | Title Company |
|---|---|---|---|
| Galiza Arnold | -- | Nevada Title Company | |
| Galiza Joanalyn Lagat | -- | First American Title Co | |
| Galiza Joanalyn L | $155,925 | First American Title Co |
Source: Public Records
Mortgage History
| Date | Status | Borrower | Loan Amount |
|---|---|---|---|
| Closed | Galiza Arnold | $150,800 | |
| Closed | Galiza Joanalyn L | $148,100 |
Source: Public Records
Tax History Compared to Growth
Tax History
| Year | Tax Paid | Tax Assessment Tax Assessment Total Assessment is a certain percentage of the fair market value that is determined by local assessors to be the total taxable value of land and additions on the property. | Land | Improvement |
|---|---|---|---|---|
| 2025 | $1,703 | $105,513 | $37,800 | $67,713 |
| 2024 | $1,654 | $105,513 | $37,800 | $67,713 |
| 2023 | $1,654 | $100,331 | $36,400 | $63,931 |
| 2022 | $1,606 | $86,163 | $27,650 | $58,513 |
| 2021 | $1,559 | $80,476 | $24,850 | $55,626 |
| 2020 | $1,511 | $79,617 | $24,500 | $55,117 |
| 2019 | $1,467 | $75,664 | $21,350 | $54,314 |
| 2018 | $1,424 | $69,173 | $17,150 | $52,023 |
| 2017 | $2,018 | $68,804 | $16,100 | $52,704 |
| 2016 | $1,350 | $63,539 | $12,250 | $51,289 |
| 2015 | $1,346 | $52,540 | $9,800 | $42,740 |
| 2014 | $1,307 | $43,229 | $7,000 | $36,229 |
Source: Public Records
Map
Nearby Homes
- 10142 Rice Paper St
- 10208 Ghost Gum St
- 10133 Rice Paper St
- 829 Dancing Vines Ave
- 10265 Moth Orchid Ct
- 638 Ribbon Grass Ave
- 911 Plantain Lily Ave
- 925 Scarlet Haze Ave Unit 2
- 10025 Catseye Cove Ct
- 10366 Emerald Rye St
- 680 Steep Canyon Ave
- 983 Plantain Lily Ave
- 10013 Solid Lime St
- 10266 Martinsburg Ct
- 627 Steep Canyon Ave
- 628 Soaring Wings Ave
- 645 Soaring Wings Ave
- 10164 Tree Bark St
- 9940 Trailing Vine St
- 710 Elliot Peak Ave
- 10198 Grecian Laurel Ct
- 10182 Grape Ivy Ct
- 10174 Grape Ivy Ct
- 10208 Grecian Laurel Ct
- 10197 Lavender Mist Ct
- 10189 Lavender Mist Ct
- 10166 Grape Ivy Ct
- 10191 Grape Ivy Ct
- 10181 Juniper Myrtle Ct
- 10216 Grecian Laurel Ct
- 10173 Juniper Myrtle Ct
- 10199 Grecian Laurel Ct
- 10207 Lavender Mist Ct
- 10183 Grape Ivy Ct
- 10209 Grecian Laurel Ct
- 10158 Grape Ivy Ct
- 10165 Juniper Myrtle Ct
- 10175 Grape Ivy Ct
- 10224 Grecian Laurel Ct
- 10215 Lavender Mist Ct