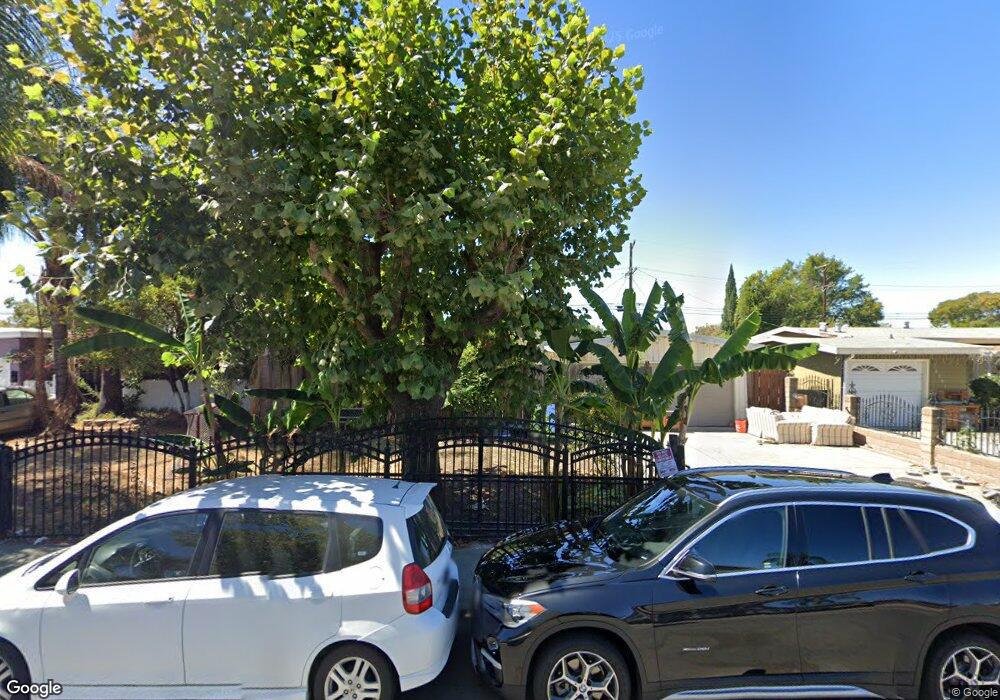
10191 Stonehedge Way San Jose, CA 95127
Alum Rock NeighborhoodEstimated Value: $853,000 - $1,010,000
3
Beds
1
Bath
1,024
Sq Ft
$905/Sq Ft
Est. Value
About This Home
This home is located at 10191 Stonehedge Way, San Jose, CA 95127 and is currently estimated at $926,930, approximately $905 per square foot. 10191 Stonehedge Way is a home located in Santa Clara County with nearby schools including Lyndale Elementary School, Joseph George Middle School, and James Lick High School.
Ownership History
Date
Name
Owned For
Owner Type
Purchase Details
Closed on
Aug 21, 2006
Sold by
Rock Ernestine E
Bought by
Nunez Eliza
Current Estimated Value
Home Financials for this Owner
Home Financials are based on the most recent Mortgage that was taken out on this home.
Original Mortgage
$444,000
Outstanding Balance
$177,159
Interest Rate
1%
Mortgage Type
Negative Amortization
Estimated Equity
$749,771
Purchase Details
Closed on
Aug 17, 2006
Sold by
Rock Ernestine E
Bought by
Rock Ernestine E
Home Financials for this Owner
Home Financials are based on the most recent Mortgage that was taken out on this home.
Original Mortgage
$444,000
Outstanding Balance
$177,159
Interest Rate
1%
Mortgage Type
Negative Amortization
Estimated Equity
$749,771
Purchase Details
Closed on
Aug 14, 2006
Sold by
Nunez Jorge
Bought by
Nunez Eliza
Home Financials for this Owner
Home Financials are based on the most recent Mortgage that was taken out on this home.
Original Mortgage
$444,000
Outstanding Balance
$177,159
Interest Rate
1%
Mortgage Type
Negative Amortization
Estimated Equity
$749,771
Purchase Details
Closed on
Dec 13, 2004
Sold by
Rock Bert P and Rock Ernestine E
Bought by
Rock Bert P and Rock Ernestine E
Create a Home Valuation Report for This Property
The Home Valuation Report is an in-depth analysis detailing your home's value as well as a comparison with similar homes in the area
Home Values in the Area
Average Home Value in this Area
Purchase History
| Date | Buyer | Sale Price | Title Company |
|---|---|---|---|
| Nunez Eliza | $555,000 | Alliance Title Company | |
| Rock Ernestine E | -- | Alliance Title Company | |
| Nunez Eliza | -- | Alliance Title Company | |
| Rock Bert P | -- | -- |
Source: Public Records
Mortgage History
| Date | Status | Borrower | Loan Amount |
|---|---|---|---|
| Open | Nunez Eliza | $444,000 | |
| Closed | Rock Ernestine E | $444,000 | |
| Closed | Nunez Eliza | $444,000 |
Source: Public Records
Tax History Compared to Growth
Tax History
| Year | Tax Paid | Tax Assessment Tax Assessment Total Assessment is a certain percentage of the fair market value that is determined by local assessors to be the total taxable value of land and additions on the property. | Land | Improvement |
|---|---|---|---|---|
| 2025 | $11,185 | $743,568 | $482,315 | $261,253 |
| 2024 | $11,185 | $728,989 | $472,858 | $256,131 |
| 2023 | $10,973 | $714,696 | $463,587 | $251,109 |
| 2022 | $10,753 | $700,684 | $454,498 | $246,186 |
| 2021 | $10,326 | $686,946 | $445,587 | $241,359 |
| 2020 | $10,141 | $679,904 | $441,019 | $238,885 |
| 2019 | $9,870 | $666,573 | $432,372 | $234,201 |
| 2018 | $9,749 | $653,504 | $423,895 | $229,609 |
| 2017 | $8,555 | $547,000 | $354,800 | $192,200 |
| 2016 | $7,497 | $491,000 | $318,400 | $172,600 |
| 2015 | $7,525 | $486,000 | $315,200 | $170,800 |
| 2014 | $6,100 | $407,000 | $264,000 | $143,000 |
Source: Public Records
Map
Nearby Homes
- 567 Nordyke Dr
- 740 S White Rd
- 318 Doris Ave
- 1122 Lancelot Ln
- 3014 Florence Ave
- 10230 Griffith St
- 13612 Emilie Dr
- 10281 Murtha Dr
- 2925 Florence Ave Unit 82
- 2925 Florence Ave Unit 67
- 2925 Florence Ave Unit 17
- 14440 Victoria Ct
- 3305 Hickerson Dr
- 3405 E Hills Dr
- 10150 Clayton Rd
- 14545 Jerilyn Dr
- 1310 Park Pleasant Cir
- 3434 Dominick Ct
- 1651 Estates Ct
- 769 Peter Pan Ave
- 10181 Stonehedge Way
- 10201 Stonehedge Way
- 10190 Kenilworth Way
- 10171 Stonehedge Way
- 10180 Kenilworth Way
- 10200 Kenilworth Way
- 13930 Highwood Dr
- 10170 Kenilworth Way
- 10161 Stonehedge Way
- 10190 Stonehedge Way
- 10180 Stonehedge Way
- 10214 Kenilworth Way
- 10170 Stonehedge Way
- 10200 Stonehedge Way
- 10160 Kenilworth Way
- 10210 Stonehedge Way
- 10160 Stonehedge Way
- 10151 Stonehedge Way
- 10150 Kenilworth Way
- 10220 Stonehedge Ct