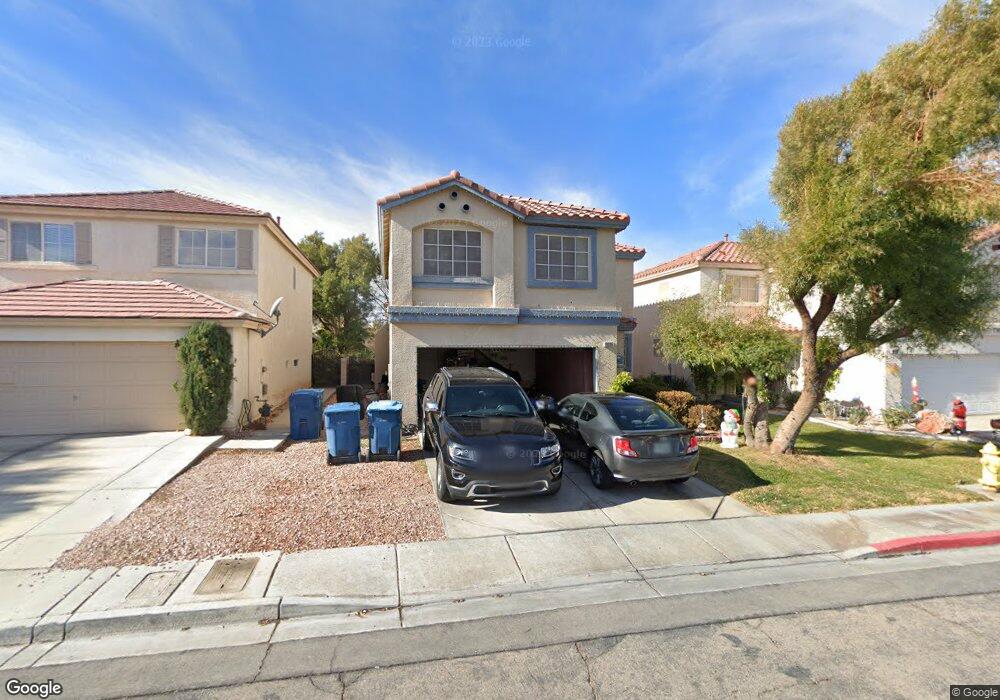
10195 Lemon Thyme St Las Vegas, NV 89183
Silverado Ranch NeighborhoodEstimated Value: $418,877 - $446,000
4
Beds
3
Baths
1,741
Sq Ft
$249/Sq Ft
Est. Value
About This Home
This home is located at 10195 Lemon Thyme St, Las Vegas, NV 89183 and is currently estimated at $432,719, approximately $248 per square foot. 10195 Lemon Thyme St is a home located in Clark County with nearby schools including John C. Bass Elementary School, Charles Silvestri Junior High School, and Liberty High School.
Ownership History
Date
Name
Owned For
Owner Type
Purchase Details
Closed on
Jun 11, 2025
Sold by
Kvv Anderson Family Trust and Anderson Kyle W
Bought by
Anderson Valerie L
Current Estimated Value
Purchase Details
Closed on
Sep 21, 2022
Sold by
Anderson Kyle and Anderson Valerie
Bought by
Kvv Anderson Family Trust
Purchase Details
Closed on
Mar 29, 2022
Sold by
Unknown
Bought by
Anderson Kyle and Anderson Valerie
Purchase Details
Closed on
Jul 29, 2021
Sold by
Sullivan Jennifer Dawn
Bought by
Sullivan Jennifer D and Jennifer D Sullivan Living Tru
Purchase Details
Closed on
Jun 1, 2001
Sold by
American West Homes Inc
Bought by
Medlin Phyllis and Medlin Guy R
Home Financials for this Owner
Home Financials are based on the most recent Mortgage that was taken out on this home.
Original Mortgage
$155,100
Interest Rate
7.14%
Create a Home Valuation Report for This Property
The Home Valuation Report is an in-depth analysis detailing your home's value as well as a comparison with similar homes in the area
Home Values in the Area
Average Home Value in this Area
Purchase History
| Date | Buyer | Sale Price | Title Company |
|---|---|---|---|
| Anderson Valerie L | -- | None Listed On Document | |
| Kvv Anderson Family Trust | -- | -- | |
| Anderson Kyle | $165,000 | Wfg National Title | |
| Sullivan Jennifer D | -- | None Available | |
| Medlin Phyllis | $156,575 | First American Title Co |
Source: Public Records
Mortgage History
| Date | Status | Borrower | Loan Amount |
|---|---|---|---|
| Previous Owner | Medlin Phyllis | $155,100 |
Source: Public Records
Tax History Compared to Growth
Tax History
| Year | Tax Paid | Tax Assessment Tax Assessment Total Assessment is a certain percentage of the fair market value that is determined by local assessors to be the total taxable value of land and additions on the property. | Land | Improvement |
|---|---|---|---|---|
| 2025 | $2,165 | $106,084 | $37,800 | $68,284 |
| 2024 | $1,856 | $106,084 | $37,800 | $68,284 |
| 2023 | $1,946 | $100,860 | $36,400 | $64,460 |
| 2022 | $1,890 | $86,641 | $27,650 | $58,991 |
| 2021 | $1,750 | $80,931 | $24,850 | $56,081 |
| 2020 | $1,622 | $80,043 | $24,500 | $55,543 |
| 2019 | $1,520 | $76,098 | $21,350 | $54,748 |
| 2018 | $1,451 | $69,603 | $17,150 | $52,453 |
| 2017 | $2,031 | $69,246 | $16,100 | $53,146 |
| 2016 | $1,359 | $63,978 | $12,250 | $51,728 |
| 2015 | $1,355 | $52,906 | $9,800 | $43,106 |
| 2014 | $1,316 | $43,524 | $7,000 | $36,524 |
Source: Public Records
Map
Nearby Homes
- 10142 Rice Paper St
- 829 Dancing Vines Ave
- 10208 Ghost Gum St
- 10133 Rice Paper St
- 10265 Moth Orchid Ct
- 911 Plantain Lily Ave
- 925 Scarlet Haze Ave Unit 2
- 983 Plantain Lily Ave
- 638 Ribbon Grass Ave
- 10025 Catseye Cove Ct
- 10366 Emerald Rye St
- 680 Steep Canyon Ave
- 9940 Trailing Vine St
- 10013 Solid Lime St
- 627 Steep Canyon Ave
- 10266 Martinsburg Ct
- 628 Soaring Wings Ave
- 710 Elliot Peak Ave
- 10047 Fine Fern St
- 645 Soaring Wings Ave
- 10187 Lemon Thyme St
- 10205 Lemon Thyme St
- 10179 Lemon Thyme St
- 10213 Lemon Thyme St
- 10196 Lavender Mist Ct
- 10206 Lavender Mist Ct
- 10188 Lavender Mist Ct
- 10171 Lemon Thyme St
- 10221 Lemon Thyme St
- 10214 Lavender Mist Ct
- 10180 Juniper Myrtle Ct
- 10180 Juniper Myrtle Ct
- 10180 Juniper Myrtle Ct
- 10194 Lemon Thyme St
- 10186 Lemon Thyme St
- 10222 Lavender Mist Ct
- 10172 Juniper Myrtle Ct
- 10204 Lemon Thyme St
- 10229 Lemon Thyme St
- 10163 Lemon Thyme St